Medical guidelines treat blood pressure as a single number. We recently analyzed 650,000 blood pressure readings and found blood pressure various by 10 mmHg from day-today. These are from objective measurements from blood pressure cuffs connected to iPhone/Android phones.
— Thoughts on what’s interesting:
- Blood pressure varies a ton.
- 10mmHg is the difference between X and Y% heart attack risk?
- Causes of blood pressure variability. Circadian rhythm, potassium/sodium ratios, etc.
- Systolic vs diastolic variability —
How much does blood pressure vary day to day?
In our data, the day-to-day change in systolic blood pressure was 10 mmHg (standard deviation), and a swing of 20 mmHg happens about 5% of the time:
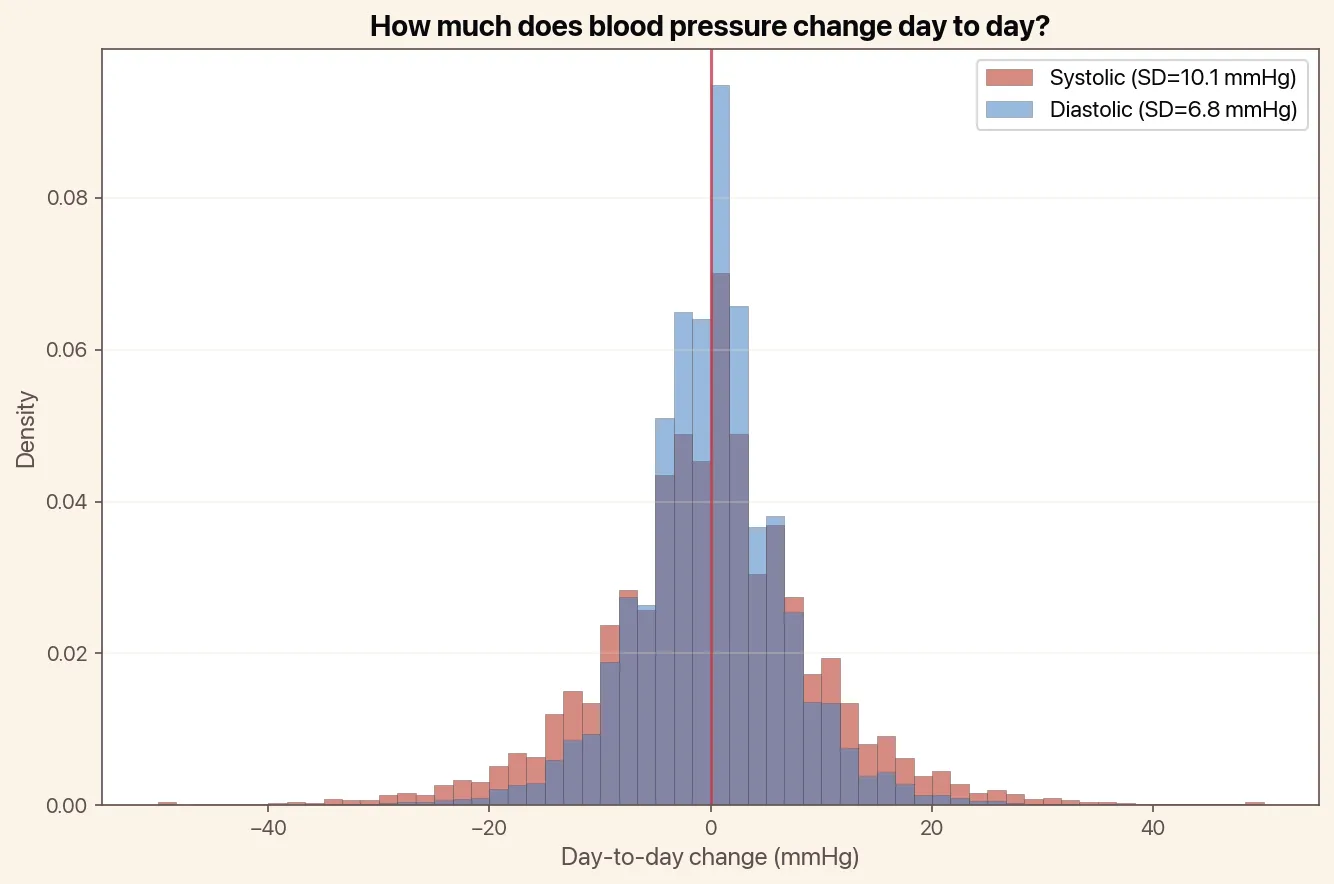 Day to day blood pressure variability (systolic and diastolic).
Diastolic pressure varied by about 7 mmHg standard deviation, which is roughly in proportion to the fact that diastolic pressure is quite a bit lower than systolic (e.g., a normal blood pressure is 120/80).
Does blood pressure variability vary between people?
Is this day to day variability coming from just a handful of people? Or does everyone’s blood pressure vary?
We analyzed within-person variability for members who took 10 or more readings. Here, the median person had a systolic standard deviation of 7.8 mmHg. The distribution is right-skewed, meaning there are a set of people with higher day to day variability who pull up the average:
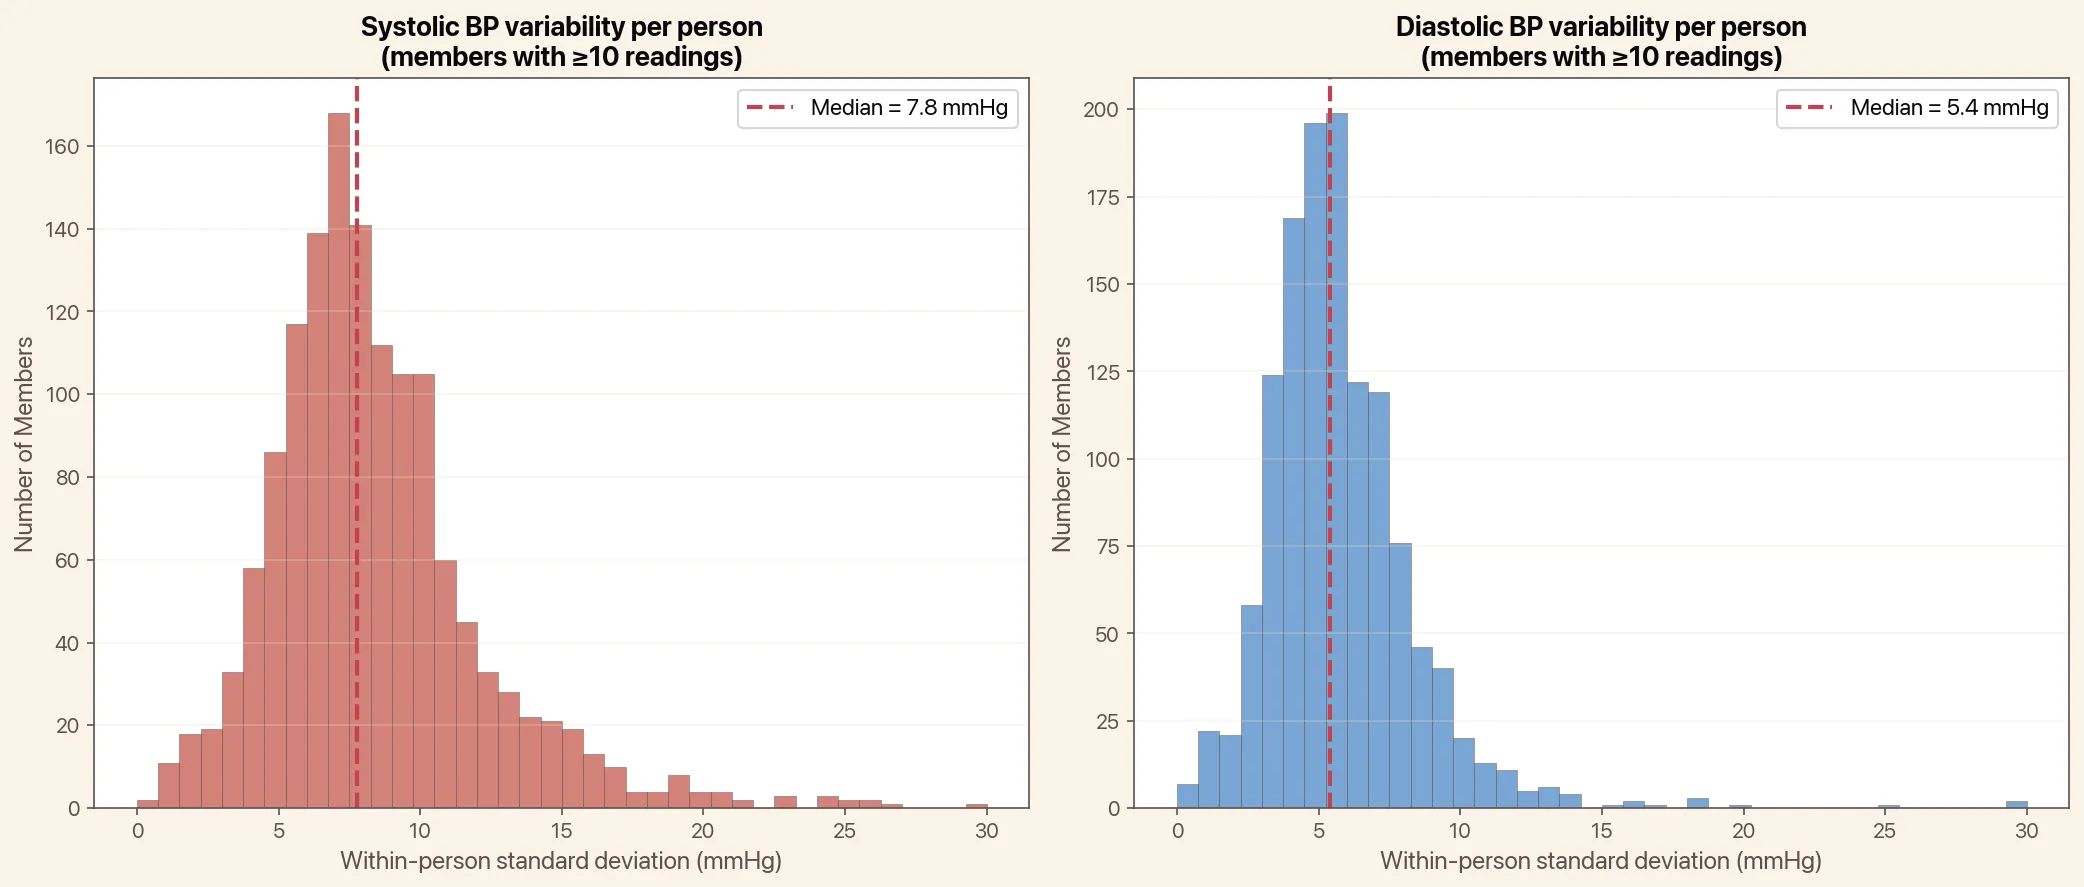 Day to day blood pressure variability, including systolic and diastolic blood pressure.
What makes blood pressure change throughout the day?
The main sources of blood pressure variability are the morning surge, coffee, exercise, eating, the white coat effect. It also various throughout the day. In healthy adults, blood pressure drops 10–20% during sleep and rises sharply upon waking. That alone accounts for a 15–25 mmHg swing before you even get out of bed (although obviously not accounted for in the cuff-based measurements above).
Here’s a quick summary of how much blood pressure varability is driven by each source:
| Trigger | Typical BP change |
|---|---|
| Morning surge (on waking) | +10–30 mmHg systolic |
| 1–2 cups of coffee | +8/6 mmHg (sys/dia), lasts 3–4 hours |
| During aerobic exercise | +40–70 mmHg systolic |
| After exercise (recovery) | -18–20 mmHg systolic, lasts up to 13 hours |
| After eating (older adults) | -20+ mmHg systolic |
| Hot shower/bath | -8–13 mmHg systolic, lasts 30–60 min |
| White coat effect (office vs. home) | +16–20 mmHg systolic |
| Sleep (vs. daytime) | -15–25 mmHg systolic |
Why a single blood pressure reading can be misleading
Given everything above, it should be clear why a single blood pressure reading (for example, taken once, in a doctor’s office, possibly after rushing to the appointment and drinking coffee) is not a reliable picture of your cardiovascular health.
“When you have your blood pressure checked in the doctor’s office, you’re in an artificial environment that is not reflective of the vast majority of the time when your blood pressure is going through its daily excursions.”
— Dr. Elliott Antman, Harvard cardiologist (Harvard Health)
The 2025 AHA/ACC Hypertension Guideline recommend home blood pressure monitoring as the diagnostic standard:
“Out-of-office BP monitoring improves accuracy in identifying hypertension… it is reasonable to exclude white-coat hypertension using out-of-office BP monitoring before a diagnosis of hypertension is made.”
— 2025 AHA/ACC High Blood Pressure Guideline, Circulation
The AHA/ACC guidelines recommend taking two readings, one minute apart, twice daily for up to 7 days to get a reliable average blood pressure.
How to keep a blood pressure log
While paper blood pressure logs can work, an app makes it easier to chart trends over time. Empirical Health tracks blood pressure readings over time. You can see how your readings change by time of day and spot patterns you’d miss on a paper log. The app also connects blood pressure to the rest of your cardiovascular picture: your heart score, VO2Max from a wearable, and heart health blood biomarkers like ApoB and Lp(a).
Is blood pressure variability a risk factor?
A growing body of evidence shows that blood pressure variability itself is a risk factor:
“Accumulating evidence suggests that increased variability of blood pressure exerts additional stress on the cardiovascular system independent of its average value, resulting in increased risk of target organ damage and cardiovascular events.”
— Journal of the American Heart Association, 2022 (JAHA)
In other words, two people with an average systolic of 125 mmHg can have very different risk profiles. The one whose readings bounce between 105 and 145 may be at greater risk than the one who stays between 120 and 130.
Blood pressure variability is an emerging signal
Like any signal, blood pressure fluctuates. Swings of 20+ mmHg in a single day are completely normal, driven by everything from your morning coffee to your sleep cycle. A single reading, taken once in a doctor’s office, is a poor representation of your actual cardiovascular health. The 2025 AHA/ACC guidelines now formally recommend home monitoring as the standard for diagnosing and managing hypertension.
Get your free 30-day heart health guide
Evidence-based steps to optimize your heart health.