Do modern LDL formulas replace ApoB?
Most LDL numbers on your lab report aren’t measured directly, but rather calculated from total cholesterol, HDL, and triglycerides. The original LDL formula (the Friedewald equation) from 1972 is being replaced with new equations like Martin-Hopkins (2013) and Sampson-NIH (2020).
One reasonable question you might have is: if calculated LDL keeps getting better, do you still need to test ApoB?
We looked at our own data to find out. Across 1,890 blood tests where we had a full lipid panel and a measured ApoB on the same day, we calculated LDL three different ways and checked how closely each tracked ApoB. While the newer formulas are better, they’re still not good enough to replace the thing they’re approximating.
Do better LDL formulas agree with ApoB?
Each formula explains some of the variation in ApoB, measured as R². A value of 1.0 would mean LDL tells you ApoB exactly. Here’s how the three formulas, plus directly assayed LDL, stack up:
| LDL estimate | Year | R² with ApoB |
|---|---|---|
| Friedewald | 1972 | 0.76 |
| Sampson-NIH | 2020 | 0.78 |
| Direct LDL (assayed) | — | 0.83 |
| Martin-Hopkins | 2013 | 0.84 |
The modern formulas beat Friedewald, by about 0.02 to 0.08 in R². But notice two things. The 2020 formula isn’t better than the 2013 one. And none of them, not even LDL measured directly in the lab, gets past about 0.84. Roughly a sixth of the variation in ApoB is invisible to any LDL number you can produce.
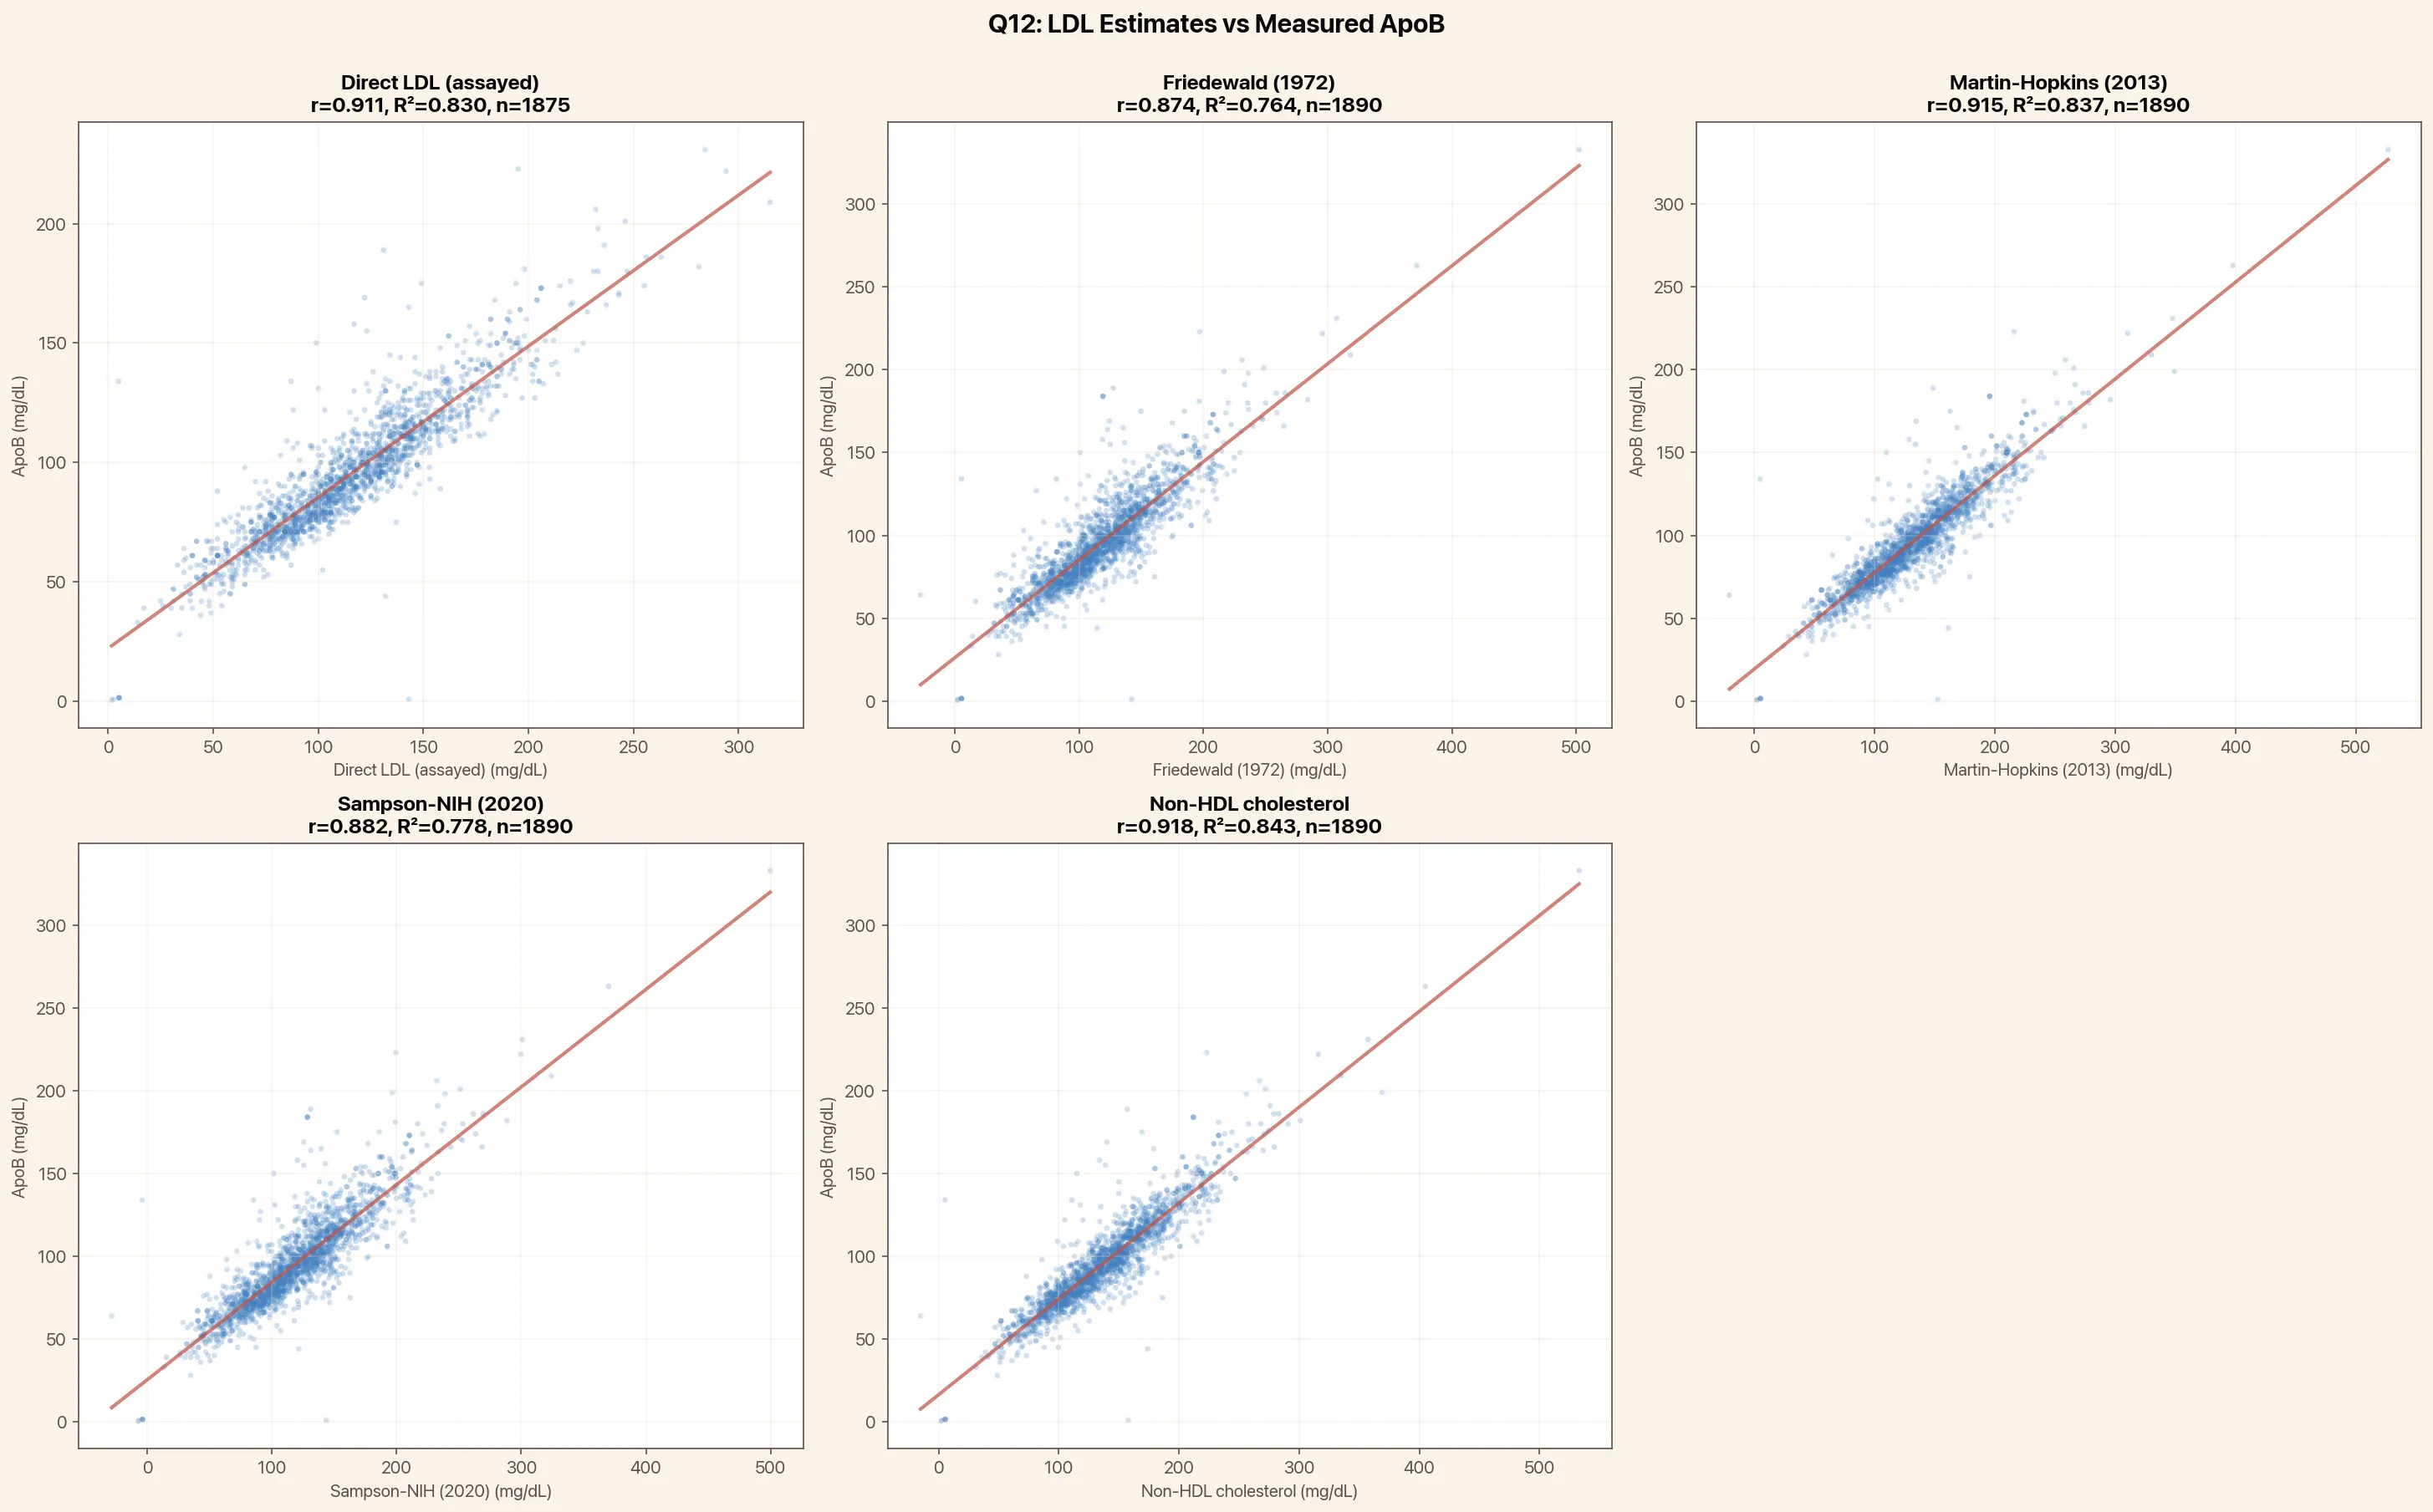 Each point is one blood draw with ApoB (y axis) vs one of its approximations (x axis). The tighter the cloud hugs the line, the better it predicts ApoB. Every panel still shows scatter, including non-HDL cholesterol (covered below).
Why LDL and ApoB disagree
LDL cholesterol and ApoB measure different things. LDL (however you calculate it) estimates the mass of cholesterol your LDL particles are carrying. ApoB counts the particles themselves, since each atherogenic particle carries exactly one ApoB protein. ApoB is the better predictor of heart disease because it’s the particles that lodge in your artery wall, not the cholesterol cargo.
The gap matters most when particles run small and cholesterol-poor, which is common in insulin resistance and metabolic syndrome. You can carry a normal load of cholesterol spread across an abnormally high number of particles. Your LDL looks fine. Your ApoB doesn’t.
We can count how often that happens. Using standard cutoffs (LDL 130 mg/dL, ApoB 100 mg/dL), 8% of people had a normal LDL but a high ApoB. That’s 1 in 12 who look reassuring on a cholesterol panel and would only get flagged by ApoB.
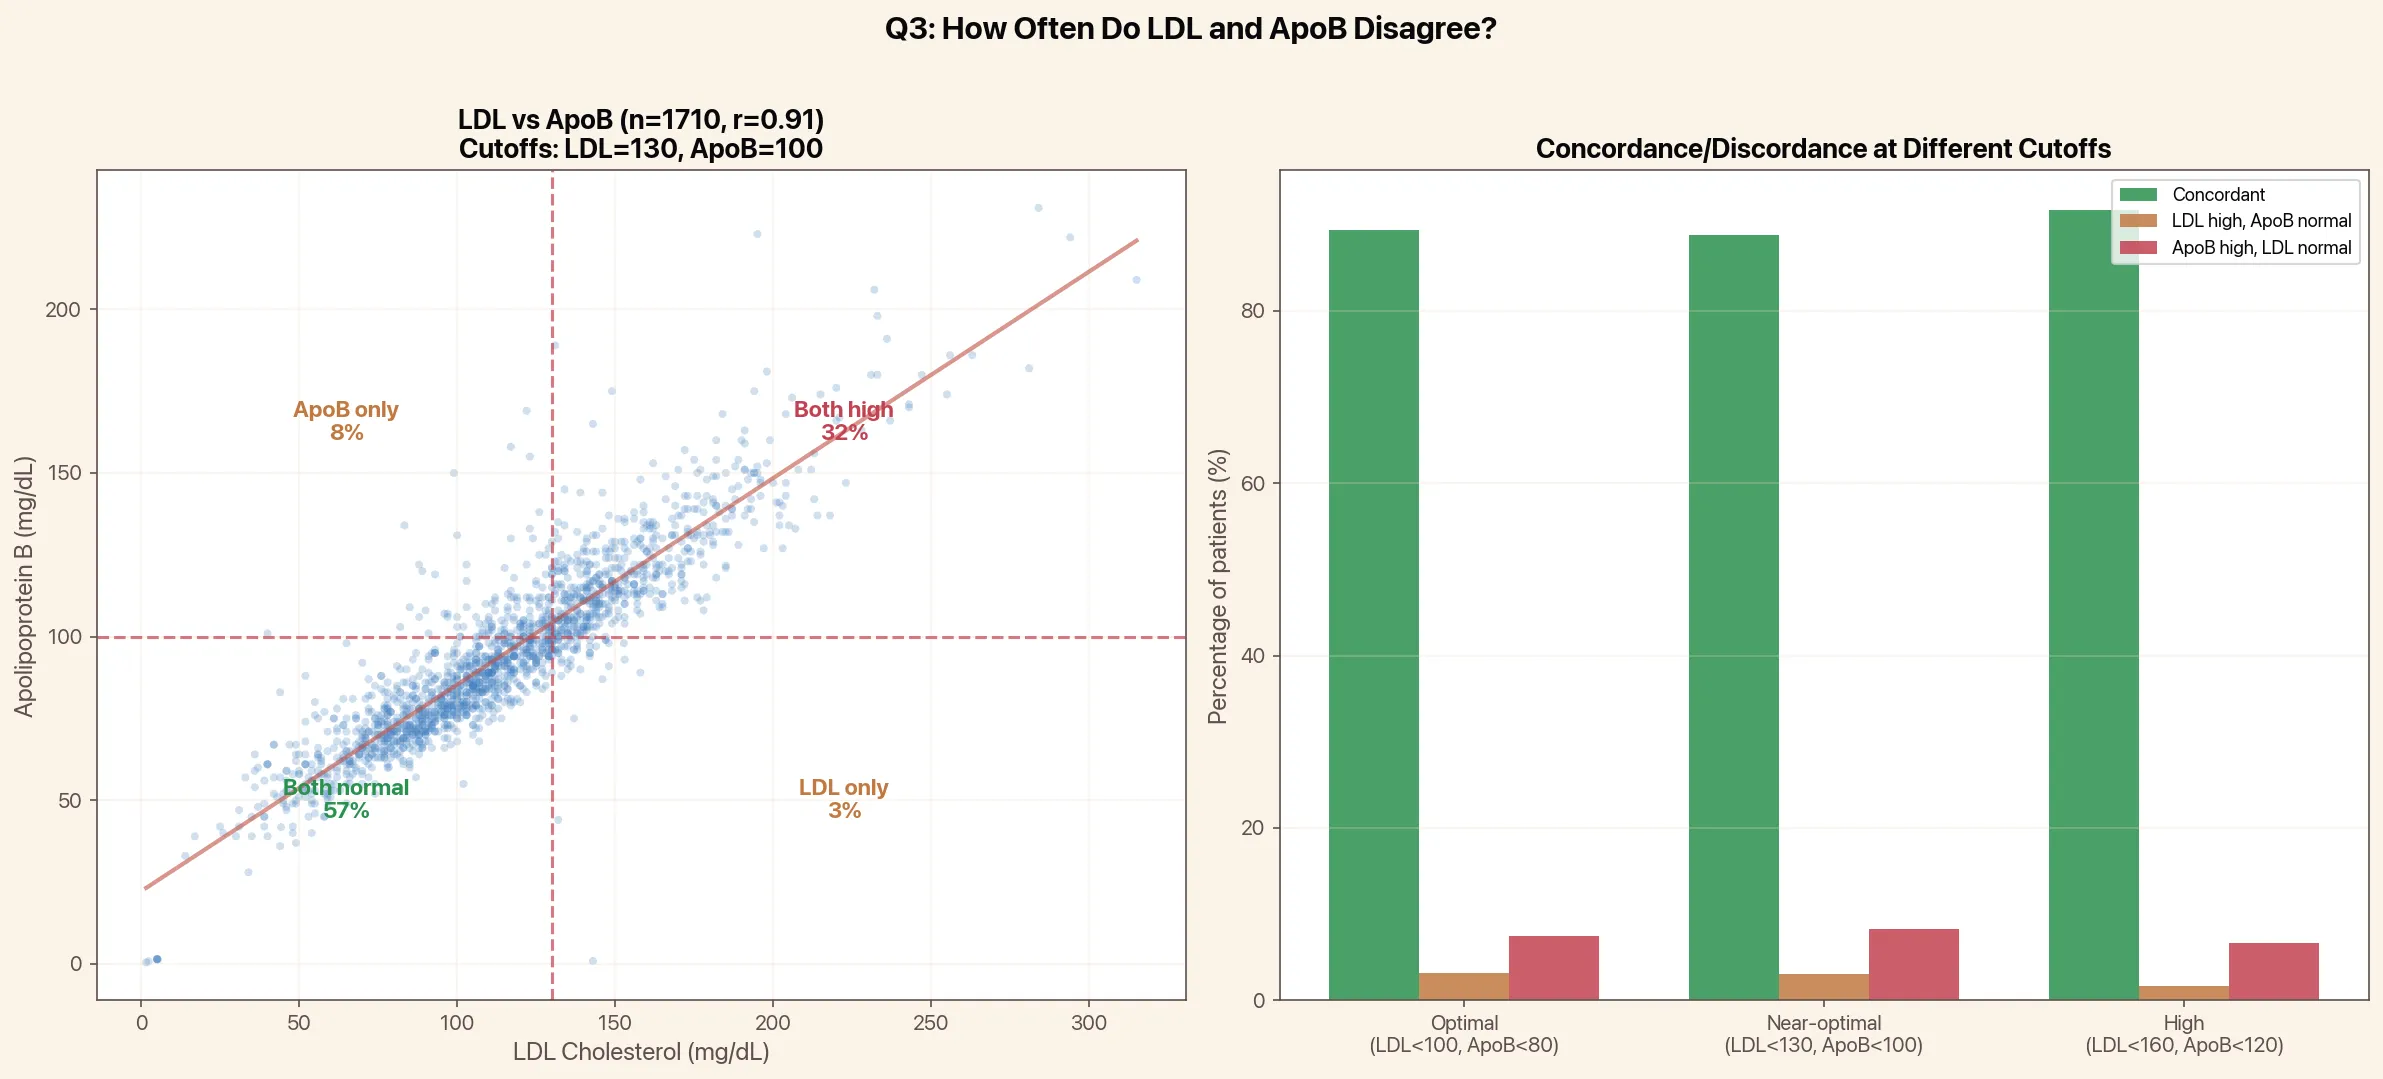 The discordant top-left group is the one that matters: normal LDL, high ApoB. The reverse error (high LDL, normal ApoB) is rarer, at 3%.
How does non-HDL cholesterol compare to ApoB?
Non-HDL cholesterol is used in many risk equations. Non-HDL has an 84% correaltion with ApoB (R²=0.84), on par with Martin-Hopkins (0.84) and direct LDL (0.83). Since non-HDL is still a cholesterol-mass measure, it shares LDL’s blind spot for particle count. Someone with small, cholesterol-poor particles can have a reassuring non-HDL and a high ApoB, the same discordance we saw with LDL.
When calculated LDL breaks down completely
There’s one situation where every formula falls apart: high triglycerides. Below 400 mg/dL, all three formulas track ApoB at about the same R² we saw overall. At or above 400, agreement collapses, and Friedewald in particular becomes unreliable enough that labs stop reporting it. We saw the same drop in our data, though only a handful of draws sat that high, so treat the size of the fall as illustrative rather than precise.
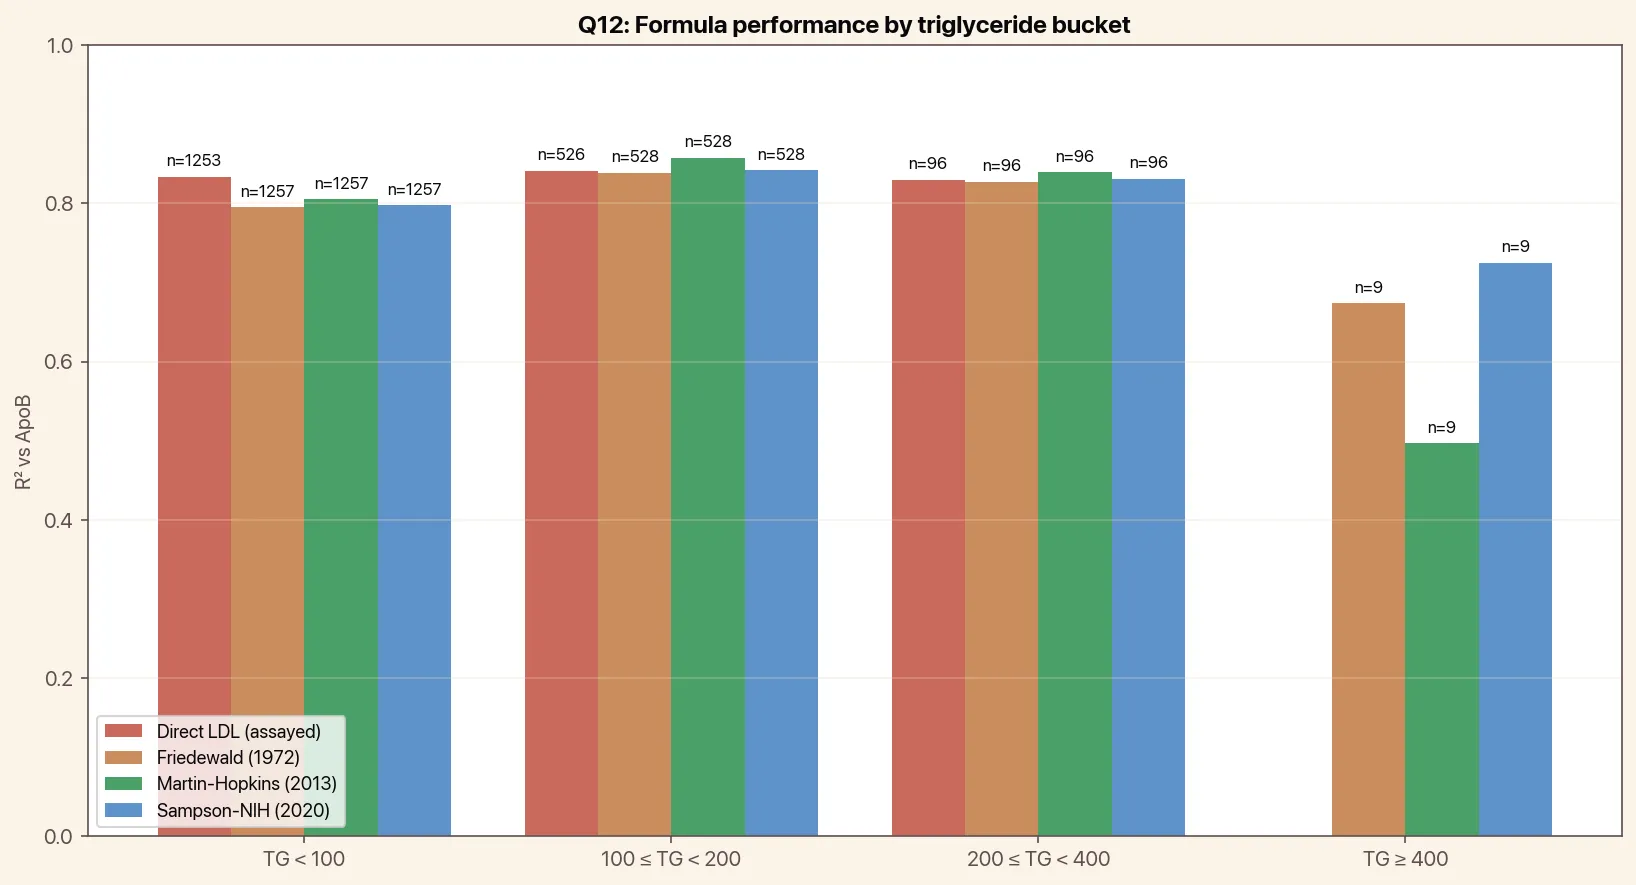 Calculated LDL holds up until triglycerides climb. Above 400 mg/dL, the formulas lose their footing.
Should you still test ApoB?
Better LDL math is a real improvement, and if your lab has moved to Martin-Hopkins you’re getting a more accurate number than your parents did. But “more accurate LDL” and “ApoB” aren’t the same goal. The best formula we tested still misses about a sixth of what ApoB sees, and flags 1 in 12 high-risk people as normal. The fix isn’t a better equation. It’s measuring the particles directly.
Empirical’s comprehensive heart health panel includes ApoB, Lp(a), hs-CRP, and a full lipid panel, with 100+ biomarkers total, for $190.
Get your comprehensive heart health panel today
Get your free 30-day heart health guide
Evidence-based steps to optimize your heart health.