Continuous glucose monitoring on Apple Watch and other smartwatches has been “5-7 years away” for roughly a decade.
In that time, we’ve seen the launches of many other health features, including ECG (2018), blood oxygen (2020), atrial fibrillation history (2022), sleep apnea (2024), and hypertension (2025). Many of these are even FDA-cleared:
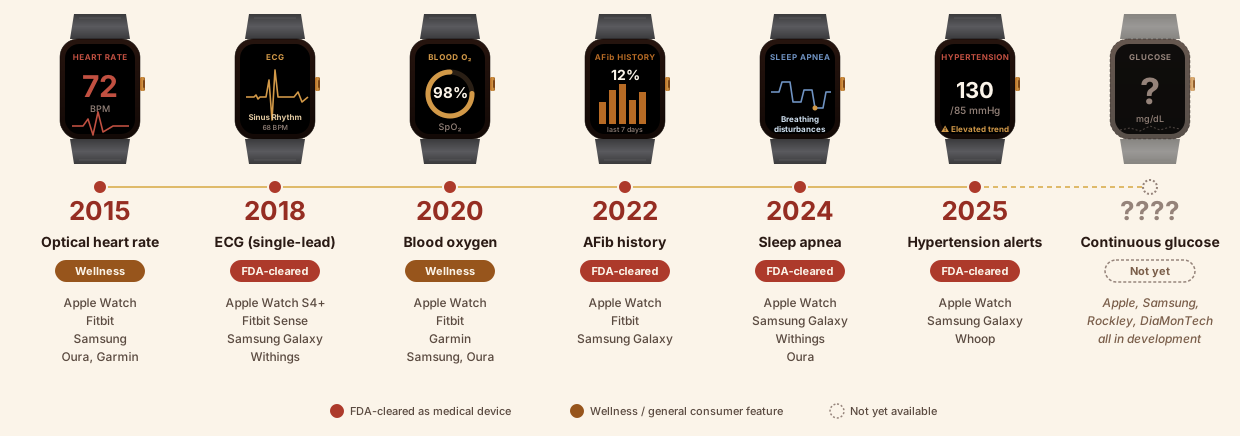
Wearable manufacturers haven’t given up. Apple Watch’s glucose project was first reported in 2017, shrunk a tabletop-sized prototype to the size of an iPhone in 2023, and got a new leader in 2026 whose background suggest commercialization is approaching.
I trained one of the first deep neural networks to detect signs of diabetes with consumer health sensors. This post will explain what makes glucose sensing so hard, what hardware and machine learning techniques have been tried, and try to describe which research techniques are actually feasible on a consumer device like an Apple Watch, Pixel, Oura, or Samsung Watch.
Let’s start by explaining why an already-launched feature, blood oxygen sensing, actually works in practice using relatively cheap optical sensors.
A less hard example: blood oxygen sensing
Blood oxygen saturation launched with the Apple Watch and other wearables in 2020. The basic technology requires shining two wavelengths of light through tissue, typically 660 nm (red) and 940 nm (infrared).
This works is for three fundamental reasons:
- Hemoglobin is abundant (about 14 g/dL in adult blood).
- Oxygenated and deoxygenated hemoglobin have distinct spectra. At 660 nm, deoxyhemoglobin absorbs about ten times more strongly than oxyhemoglobin. At 940 nm, the relationship flips, which means the absorbsion ratio gives you oxygen saturation nearly directly.
- The PPG signal has both AC (pulsing arterial blood) and DC (skin, bone, venous blood) components. Subtracting DC from AC isolates what’s happening in blood.
The result is that you can measure blood oxygen on the wrist with relatively inexpensive hardware: “just” two cheap LEDs and a photodetector.
Why glucose is inherently harder than hemoglobin

On the left, light from an LED enters the skin, follows a banana-shaped path down through the epidermis, dermis, and blood vessels (which pulse, enabling the AC/DC trick), and scatters back up to a photodetector a few millimeters away, so it crosses every layer twice. On the right, the absorption spectra of the four molecules the light interacts with, over 600 to 1900 nm: oxygenated and deoxygenated blood look different at 660 and 940 nm, water dominates tissue absorption with a huge band near 1450 nm, and glucose is spread through every layer but is about 1000x too weak to see without magnification.
Among all three dimensions above, glucose is a harder molecule: glucose is 1400x less concentrated than hemoglobin, has no isolated light wavelengths, and the AC/DC trick doesn’t work:
| Property | Glucose | Hemoglobin (Oxygen) |
|---|---|---|
| Concentration in blood | ~90 mg/dL | ~14,000 mg/dL |
| Spectra | No isolated absorption peaks in visible/NIR; weak C-H overtones masked by water | Distinct oxygenated/deoxygenated peaks at 660 and 940 nm |
| AC/DC Trick | Not effective since glucose is everywhere and not pulsed | Highly effective |
Glucose doesn’t have isolated absorption peaks in the visible or near-infrared. It has C-H bond vibrations around 1500-1850 nm and 2050-2330 nm, but those are also absorbed strongly by water in those same regions. The signal from water is about 1000x stronger than glucose, leading to an awful lot of noise. Furthermore, glucose isn’t confined to pulsing blood since it’s found in plasma, red cells, interstitial fluid, and so on, which means the AC/DC trick doesn’t work. This is why despite 30 years of research, there’s still no FDA-cleared non-invasive glucose monitoring technology.
Non-invasive glucose monitoring techniques people have tried
Medical research has tried many approaches noninvasive glucose sensing, which cluster into six categories: NIR, MIR, Raman, photoacoustic, fluorescence, and PPG + machine learning.
The main accuracy metric used for glucose sensing is mARD: mean Absolute Relative Difference. To calculate mARD, you take multiple readings from a CGM and compare it to a reference. Each reading has a relative difference of (reading-reference)/reference; if you take the mean of the absolute value of these differences, that’s mARD. A mARD of 10% or less is considered accurate. Modern CGMs (e.g., FreeStyle Libre 3, Dexcom G7) achieve an mARD of about 8%.
Near-infrared spectroscopy
NIR (700 to 2500 nm) is the obvious starting point since it’s same basic tech as oxygen and heart rate sensing. We covered the problems with concentration, specta, and AC/DC above. While small proof-of-concept studies of NIR techniques report 5–8% mARD, broader prospective human studies cluster around 20-25% mARD.
Mid-infrared spectroscopy
What if we change the wavelength of our optical sensors? Glucose has distinct vibrational fingerprints in the mid-infrared range, but the problem is depth. MIR only penetrates 60 to 100 microns into skin. At that depth, there’s no arterial blood but there is interstitial fluid, whose glucose tracks blood glucose (this is the same basic principle CGMs rely on).
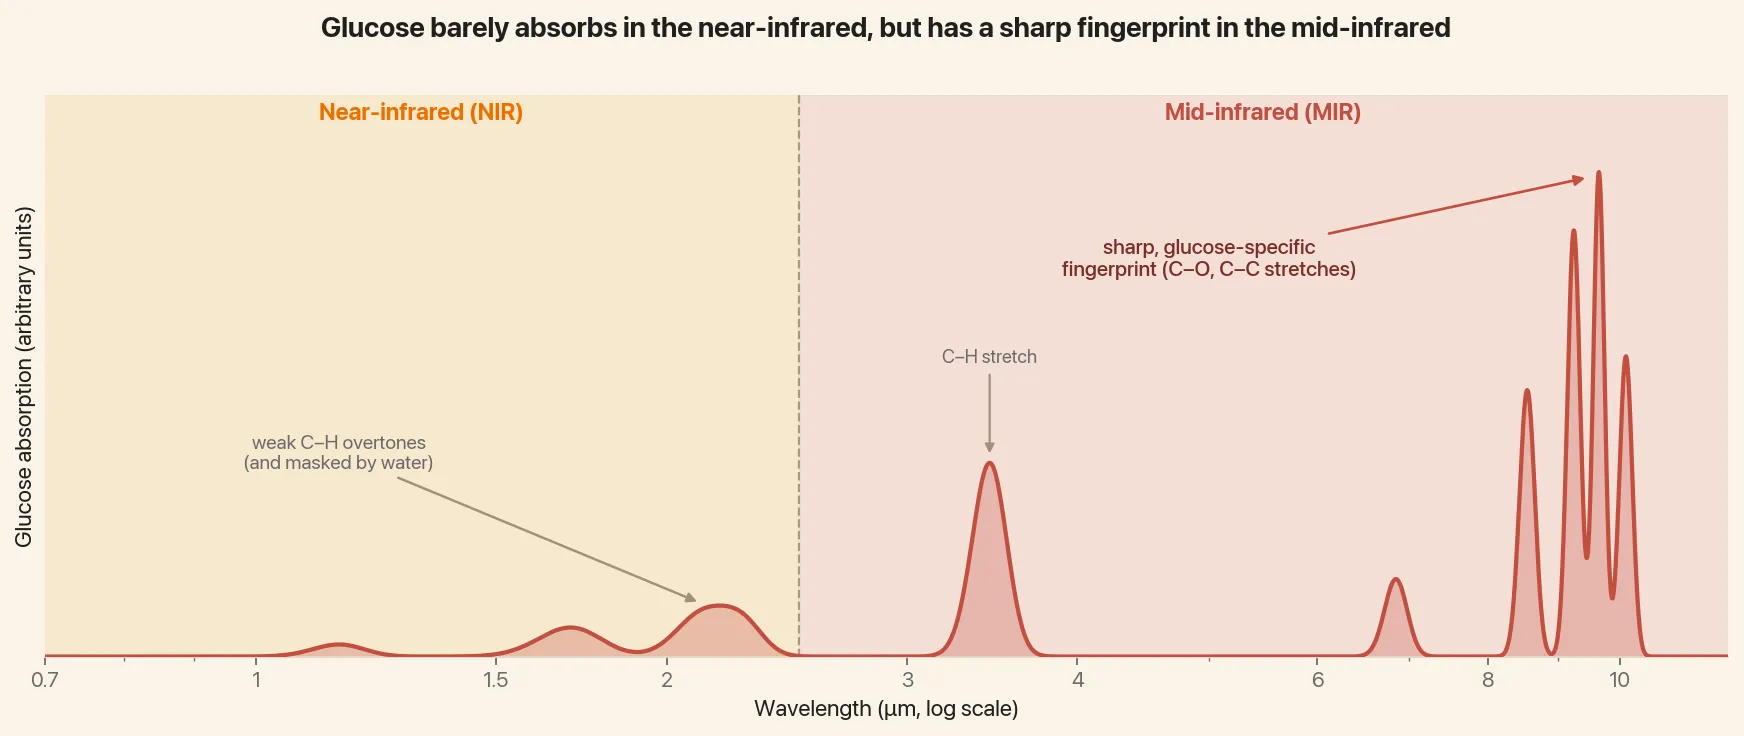
Glucose’s near-infrared overtones (left) are weak and non-specific. Its mid-infrared fundamentals (right) are sharp and glucose-specific, a real molecular fingerprint. That specificity is what makes mid-infrared devices accurate. The catch is depth.
A German company, DiaMonTech, has built MIR spot-check devices that achieve around 12% MARD in controlled clinical trials, which is quite promising. One problem is that hardware is the size of a smartphone, not a wristwatch (recent rumors suggest Apple’s glucose prototypes are roughly the size of an iPhone, with further work on miniturization needed to shrink it down to a watch form factor).
Raman spectroscopy
When photons are scattered, most undergo Rayleigh scattering, where energy/frequency/wavelength/color is unchanged.
But about 1 in every 1,000,000 photons undergo Raman scattering, where they gain or lose energy. Since different chemical bonds and molecular structures produce characteristic vibrational patterns and energy jumps, the Raman spectrum acts like a molecular fingerprint. (Side note: CV Raman won the 1930 Nobel Prize in Physics for this discovery.)
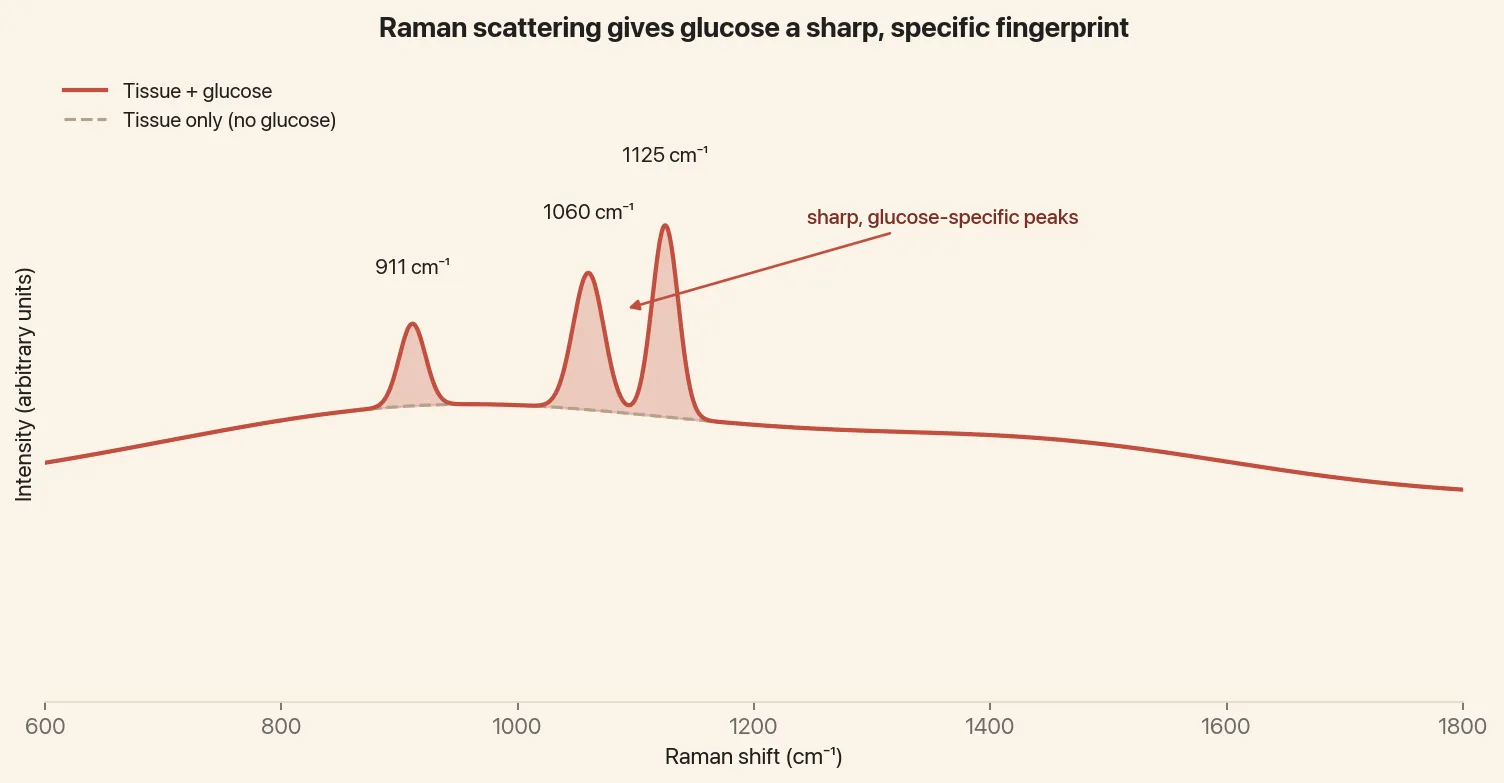
Raman spectroscopy gives sharp, glucose-specific peaks at 1125 and 1060 cm⁻¹. The challenge is that since only 1 in 1,000,000 photons scatter inelastically, you need to use a laser and have long exposure times to get an accurate measurement. A tabletop Raman device, GlucoBean, showed 14.3% mean absolute relative difference. MIT published a wrist-form-factor Raman CGM in 2025 at 11.69% MARD, albeit with a very small n=1 sample.
Photoacoustic spectroscopy
Photoacoustic spectroscopy turns light into sound. A laser fires rapid pulses into the skin. Glucose absorbs the light, heats up a tiny bit, and expands, sending out a faint pressure wave that an ultrasound mic picks up. The more glucose, the louder the click. The problem is the click also shifts with the state of your skin. Sim et al. (2018) concluded this is likely infeasible: “The repeatability of such a method is susceptible to changes in skin condition, which is dependent on hand washing and drying.”
Fluorescence sensor
Eversense is an FDA-approved implantable fluorescence sensor placed in the upper arm for 180 days. Eversense’s fluoresecence sensor achieves about 8.5% MARD (comparable to the leading invasive CGMs). The sensor has a special material that binds to glucose, changing its glow levels. This is similar, in principle, to CGMs, glucometers, and lab assays, which all use glucose-binding biochemistry as an intermediate. Unfortunately, this is not an especially feasible technique for an Apple Watch-like device.
PPG plus deep learning
Most smartwatches already have an optical heart rate sensor. If you train a model on enough PPG waveforms paired with finger-stick glucose readings, and paired it with a deep neural network, could you pick up subtle patterns that are invisible to the naked eye?
There are some prototypes that do this. Chu et al. (2021) reported 94% accuracy in a small cohort using quarterly HbA1c as a feature, but when they scaled to 2,538 subjects, accuracy collapsed to 60%. The reason is that PPG models tend to learn each subject’s baseline (HbA1c, age, BMI, etc) rather than glucose dynamics. However, this situation is not so different than smartwatch-based blood pressure detection, which does have to be periodically recalibrated with a cuff.
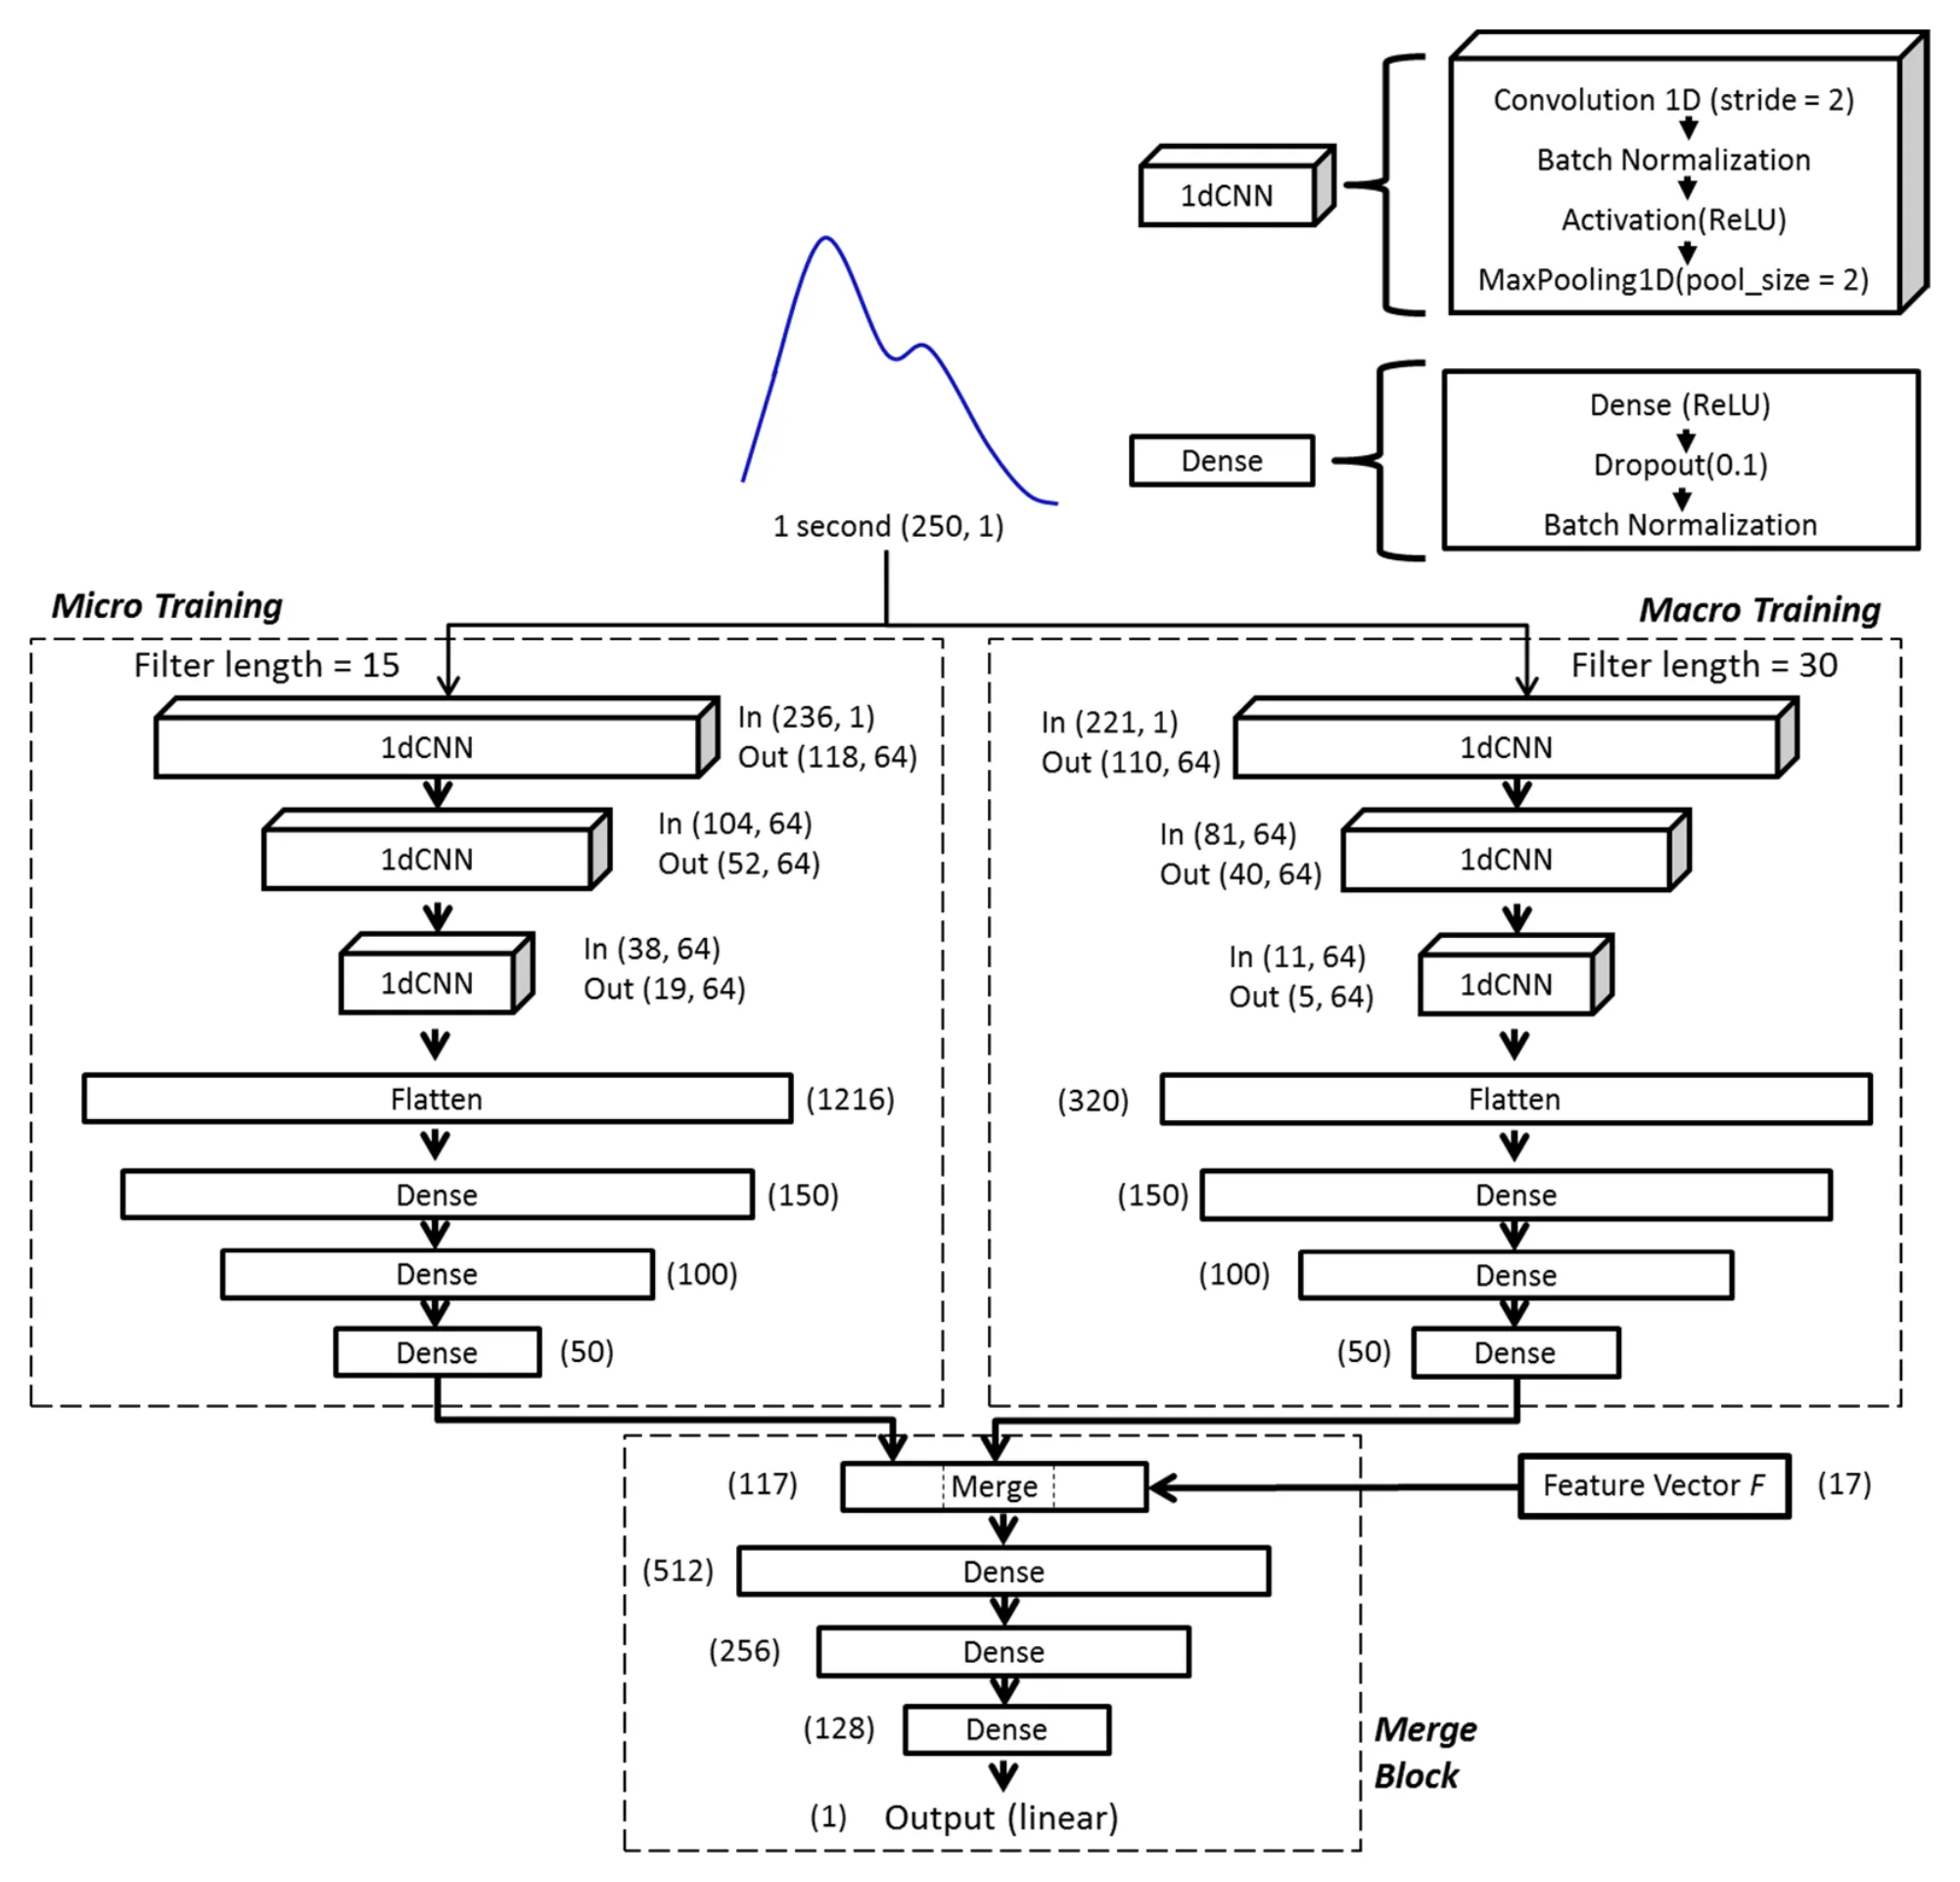
Model architecture from Chu et al., Sensors 2021. Note how the network leans on the feature vector F, including quarterly HbA1c, which is lets it learn a subject’s baseline rather than moment-to-moment glucose.
Apple built the more powerful version of this. Instead of a small supervised CNN, Apple trained a foundation model on the raw PPG and ECG waveforms of about 141,000 people in its Heart and Movement Study. It learns with no labels at all, just by studying millions of waveforms, and encodes each one into 256-dimensional embedding vector that captures a person’s cardiovascular physiology.
Then, Apple used linear probing to train the last layer of the foundation model to detect hypertension. Could the same work for glucose?
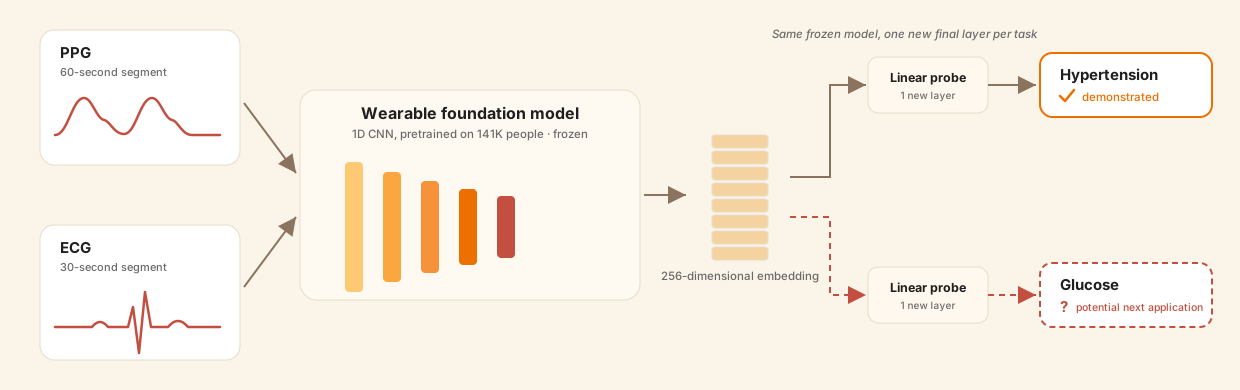
Apple’s foundation model turns raw PPG and ECG into a 256 dimenional embedding, then adapts to each task by training one small layer on top (linear probing). It works for hypertension notifications, which were FDA-cleared in 2025. Whether the same embedding contains a sufficiently strong glucose signal is the open question.
Several studies have also shown that PPG does cary signal related to glucose metabolism and diabetes. For example, DeepHeart demonstrated that deep neural networks trained on photoplethysmography (PPG) and heart rate variability data from commercial wearables like the Apple Watch could detect diabetes with an AUC of 0.85. Similarly, a UCSF study used smartphone-based PPG readings to predict diabetes status, yielding impressive results. These approaches suggest there’s some signal in PPG data. Conceivably, a modern version of this could work, especially when combined with hardware changes (say, to enable MIR and Raman).
Which of these techniques is likely for consumer wearables?
Out of NIR, MIR, Raman, photoacoustic, fluorescence, and PPG + machine learning, which are most plausible for a consumer wearable form factor like Apple Watch, Samsung Galaxy watch, or Oura?
If I directly compare the published mARD (accuracy) values across these techniques:
| Technique | Published Performance | Notes |
|---|---|---|
| Near-Infrared (NIR) | ~20–25% MARD | Weak, non-specific overtones; limited accuracy in literature |
| Mid-Infrared (MIR) | ~12% MARD | DiaMonTech: ~12% MARD in trials; miniaturization is a challenge |
| Raman Spectroscopy | 11.7–14.3% MARD | MIT 2025 prototype: 11.7% (n=1); GlucoBean: 14.3% |
| Photoacoustic Spectroscopy | — | Infeasible due to skin variability (Sim et al., 2018) |
| Fluorescence Sensor | 8.5% MARD | Eversense (implantable, not wearable) |
| PPG + Machine Learning | 60–94% accuracy* | *Not MARD; accuracy drops in large cohorts (Chu et al., 2021) |
*Accuracy is not directly comparable to MARD but reported here for context when MARD not available.
Then I think the most likely path will involve advanced machine learning (Apple, Google, and Empirical Health have all published work on unsupervised physiological models) and a hardware change (likely MIR or Raman) to bring in more raw signal. Given the rumors that Apple has shrunk a tabletop-sized prototype to the size of an iPhone, it appears they also believe hardware will be required for accurate glucose sensing.
Get your free 30-day heart health guide
Evidence-based steps to optimize your heart health.