The Pixel Watch 5, to be released August 20, measures insulin resistance from wrist-based sensors alone. In Google’s validation data, the accuracy was 75% with wearable data alone and 88% when labs were included. How does it do that?
In 2018, I helped train the first deep neural network to detect signs of diabetes from consumer heart rate sensors. Wearable models have scaled significantly since then: Google’s SensorFM was trained on data from 5 million participants, compared with 14,000 in our 2018 study. Much of the underlying science is the same.
In this article, I’ll explain the signals of insulin resistance latent in heart rate data, how modern large-scale sensor foundation models work, the accuracy and validation that’s been published, and where the gap is between this work and the “holy grail” of continuous glucose monitoring on the wrist.
Insulin trends != glucose monitoring
Google calls the feature Insulin Resistance Trends, not glucose monitoring. There’s a reason for that. This feature runs on the background, and then reports noteworthy shifts in a monthly Health Gaurdian summary in the Google Health app. Rather than seeing a glucose measurement, you see a trend like “High”.
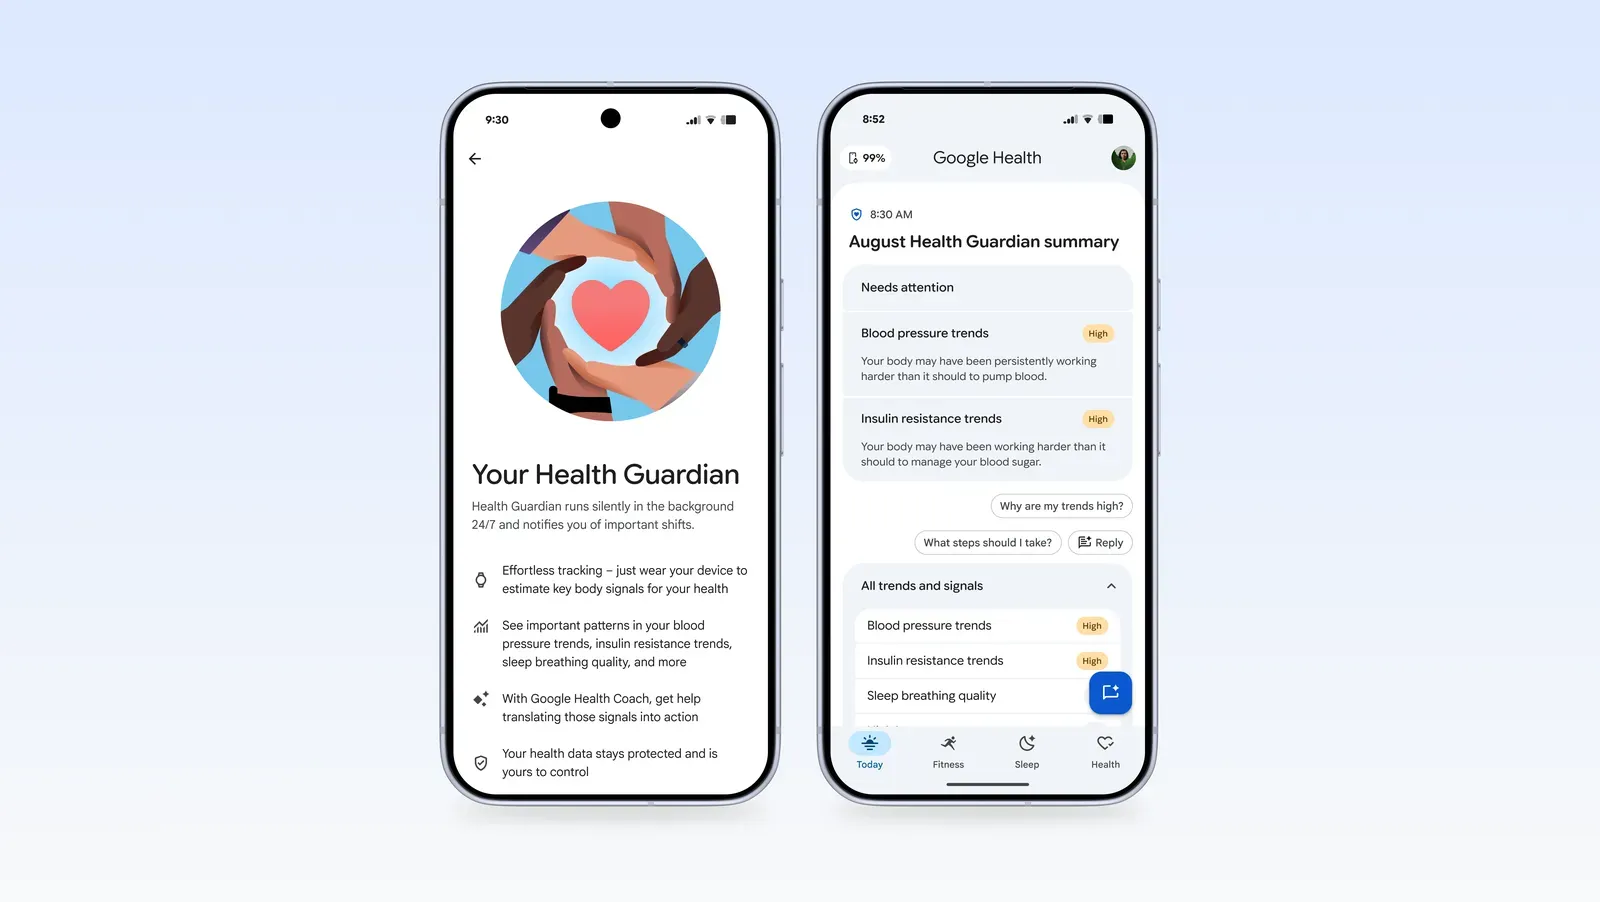 Insulin restance trends appear as part of a monthly “Health Guardian” summary. Screenshot: Google.
So, this is not continuous glucose monitoring, which is still the holy grail of wearables. Still, insulin trends is a big advance. Insulin trends is coming in September 2026 (availability will bary by country and device).
How Google’s wearable foundation model works
Google built insulin trends with SensorFM, a model pretrained on wearable data from five million people. The published insulin-resistance validation used LSM-2, an earlier version of the same approach.
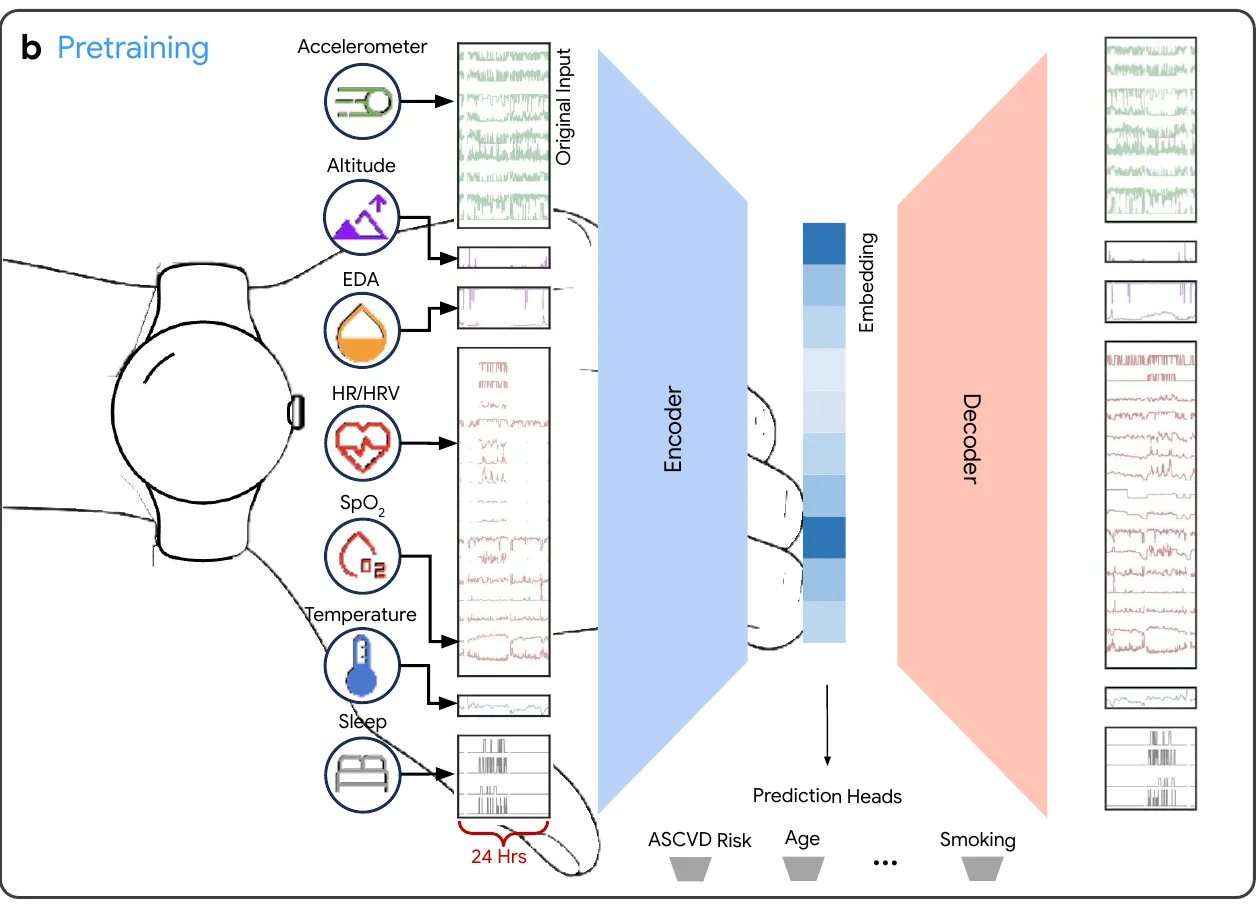 SensorFM compresses 24 hours of signals into an embedding. Small prediction heads are used for specific outcomes. Source: SensorFM paper.
SensorFM reads a full day of sensor data at one-minute resolution. Inputs include heart rate and HRV derived (photoplethysmography), motion and sleep (accelerometer), skin temperature, electrodermal activity, and elevation. During pretraining, the model sees billions of hours without health labels. Parts of each day are hidden, and it learns to reconstruct them from the surrounding signals.
The output for each day is an embedding: a vector of numbers that summarizes the relationships the model found among physiology, behavior, and time. For insulin-resistance prediction, Google combines these daily embeddings across several weeks and trains a much smaller model against HOMA-IR. HOMA-IR is just estimate calculated from fasting insulin and fasting glucose: $\text{HOMA-IR} = (\text{fasting insulin} \times \text{fasting glucose}) / 405$.
Can we visualize what the embedding contains? Yes. Researchers compressed it to two dimensions with UMAP and colored the same map by different health characteristics. Age and BMI form visible gradients. HOMA-IR is much sparser and subtler, but it occupies that same learned physiological space.
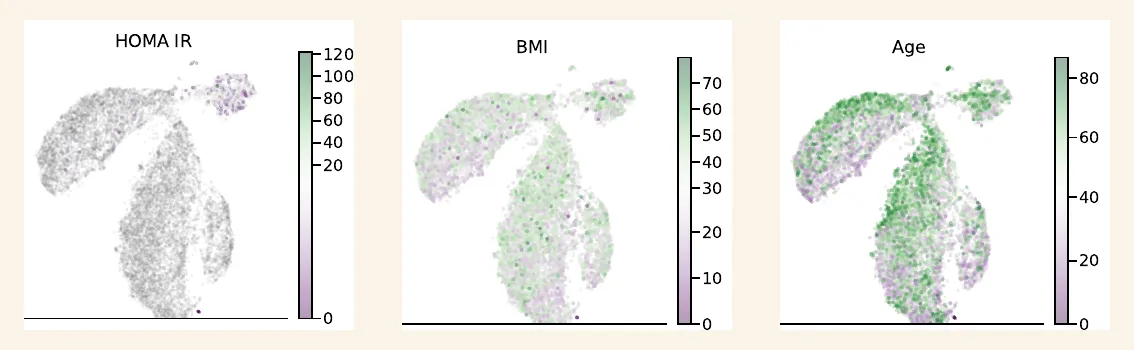 SensorFM latent space, projected into two dimensions and colored by HOMA-IR, BMI, and age.Source: SensorFM paper.
SensorFM obeys its own scaling law
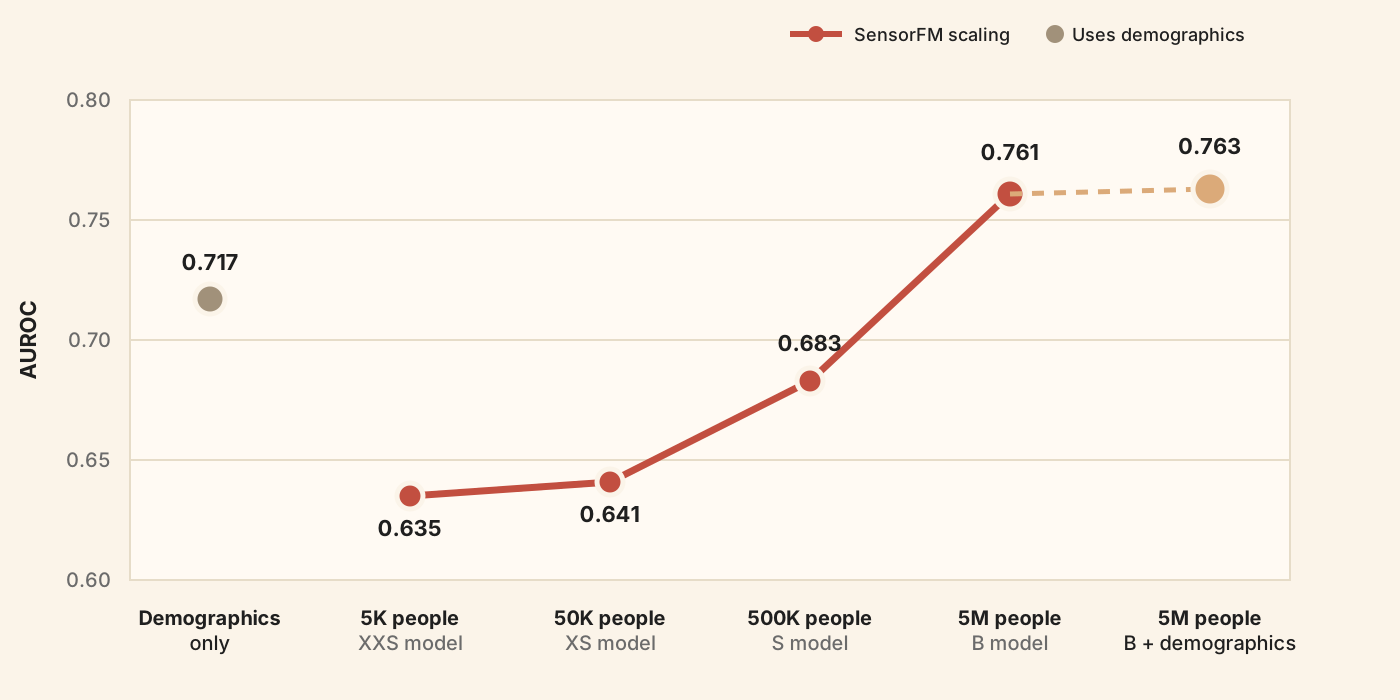
Similar to LLM scaling laws, SensorFM’s insulin-resistance accuracy improved as Google increased both its training population and model size. AUROC rose from 0.635 with 5,000 participants to 0.761 with five million, slightly above the demographics-only baseline. Adding demographics to the largest model reached 0.763.
What signals of insulin resistance are in heart rate data?
Our 2018 neural network detected diabetes from heart rate and accelerometer data with an AUROC of 0.85, but it didn’t identify which parts of the signal mattered. Subsequent work by my collaborator Geoff Tison at UCSF trained a model on 2.6 million photoplethysmography (PPG) recordings and reached an AUROC of 0.766. A second model that discarded the shape of the pulse wave and kept only the interval from one beat to the next still reached 0.721. Most of the useful signal appeared to be in beat-to-beat timing, a measure closely related to heart rate variability.
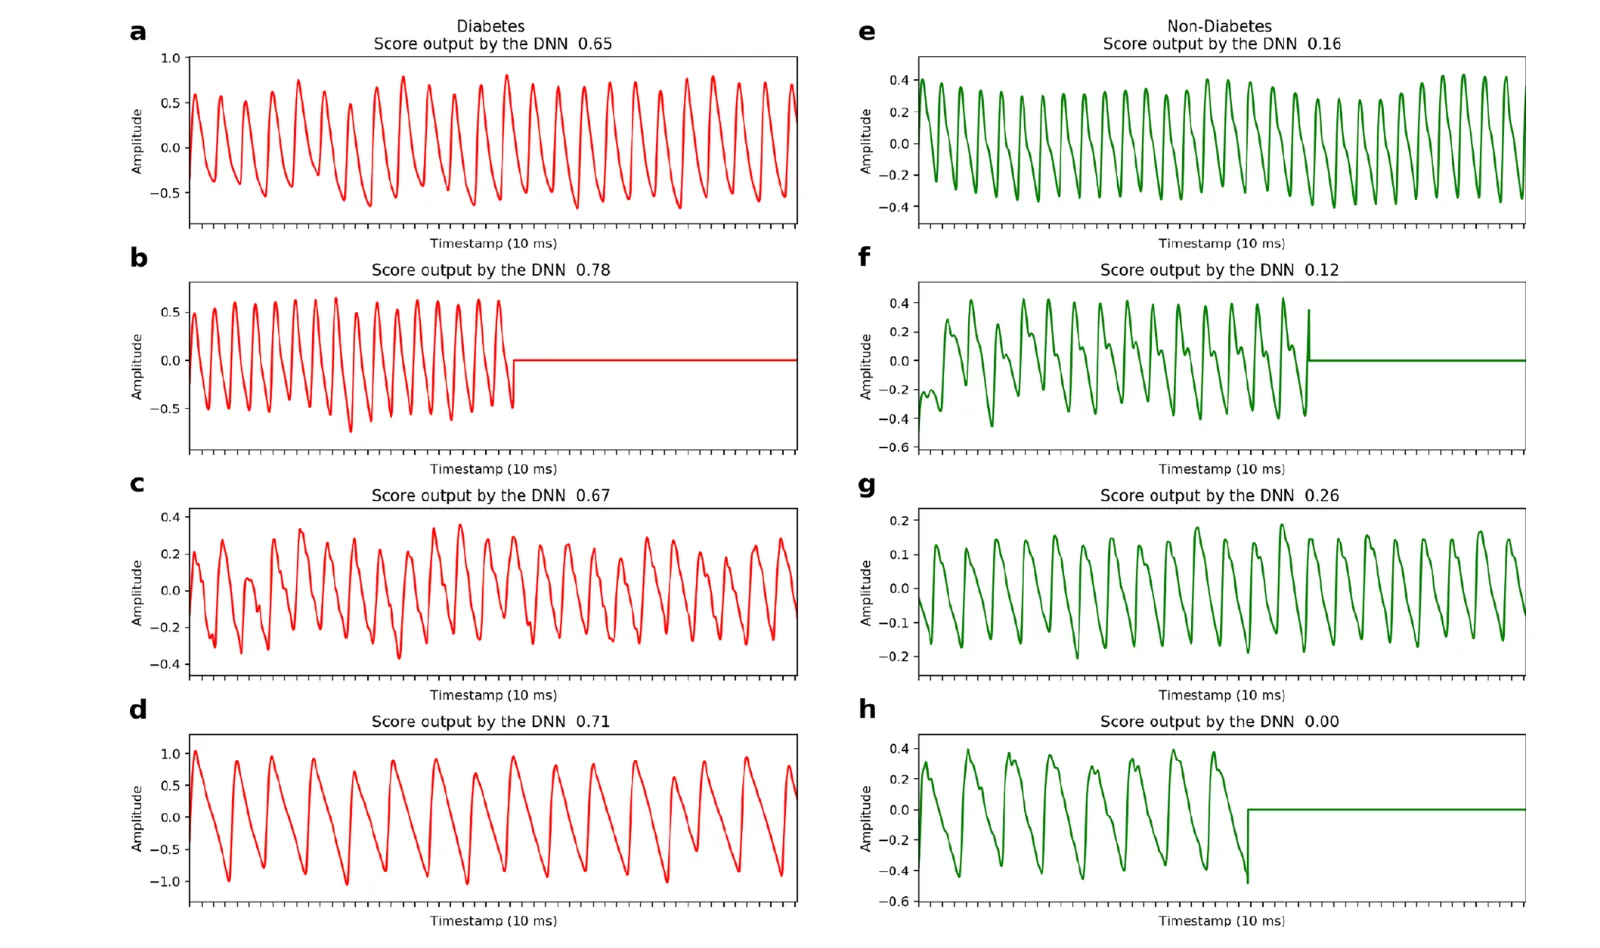 PPG waveformss with and without diabetes, from a UCSF study from the Tison lab.
The autonomic nervous system (ANS) is ultimately what links insulin resistance with heart rate data. Its sympathetic branch raises heart rate, while its parasympathetic branch slows the heart and creates more beat-to-beat variation. The vagus nerve also connects to ganglia in the pancreas and helps regulate insulin secretion. As tissues become insulin resistant, the pancreas releases more insulin; controlled insulin-clamp studies show that higher insulin can shift autonomic balance toward sympathetic activity. Google’s study found the expected pattern: HOMA-IR rose with resting heart rate (r = 0.27) and fell with daily steps (r = -0.25) and HRV (r = -0.14).
 The autonomic nervous system connects the brain with the heart, pancreas, and other organs.
How accurate is wearable insulin-resistance prediction?
Accuracy depends on the data the model receives. The best accuracy (AUROC) was 88% but requires wearable data and labs (including fasting glucose, which is one component of HOMA-IR):
| Inputs | Study population | AUROC | What the result tests |
|---|---|---|---|
| Wearables plus age and BMI | Initial WEAR-ME cohort | 0.70 | Simple aggregated wearable features |
| Foundation-model wearable data only | Held-out WEAR-ME test set | 0.80 | Detailed wearable patterns without demographics |
| Foundation-model wearable data plus age and BMI | Held-out WEAR-ME test set | 0.82 | Research result closest to a watch-based screen |
| Foundation-model wearable data plus age and BMI | Independent validation cohort | 0.75 | Generalization to 72 new participants |
| Age, BMI, fasting glucose, and lipids plus foundation-model wearable data | Independent validation cohort | 0.88 | Wearables combined with blood tests |
(As a quick review, an AUROC of 0.75 means that if the model receives one randomly selected person with insulin resistance and one without it, it will rank the person with insulin resistance as higher risk about 75% of the time. It does not mean that 75% of individual readings are correct.)
The independent validation is encouraging because the researchers froze the model and tested it on people who were not part of training. But it included only 72 participants, 19 of whom had insulin resistance. They all wore a Fitbit Charge 6 and had an average BMI of 30.6. Larger studies will need to show how well the model works across devices, body sizes, skin tones, medications, illnesses, and patterns of missing data.
There is one more limit: the study compared the model with HOMA-IR, not the hyperinsulinemic-euglycemic clamp, the laboratory gold standard. HOMA-IR itself varies between measurements and laboratories. The paper cites 23.5% variation between two measurements in the same person.
What should you do with an insulin-resistance trend?
Is your insulin resistance terend high? That should prompt a conversation wiht a doctor. When appropriate, they’ll order confirmatory testing, such as fasting glucose and insulin, HbA1c, lipids, blood pressure, waist circumference, medications, and family history.
Insulin resistance is never going to be 100% accurate on a wearable. Illness, poor sleep, reduced activity, or a medication change can shift wearable signals.
Insulin resistance trends is likely most useful before glucose becomes abnormal. One in five participants with normal glucose in Google’s study already met its HOMA-IR threshold for insulin resistance. A Pixel Watch is not a glucose sensor, but it could turn everyday heart rate, sleep, and activity data into an earlier metabolic screening signal.
Get your free 30-day heart health guide
Evidence-based steps to optimize your heart health.