The first Framingham cardiovascular risk profile was published in 1976, covering coronary disease, stroke, claudication, and heart failure. Since then, there’s been an explosion of variants: PREVENT, ASCVD, SCORE2, QRISK3, Reynolds, and more. What are the differences, and which one should you use? Framingham’s first risk profile
Every model returns a percentage, but the percentages aren’t interchangeable. This guide compares the major general-population models, their inputs, and time horizons, then looks at the fairest head-to-head evidence. It also explains why reported c-statistics can’t be used as a league table.
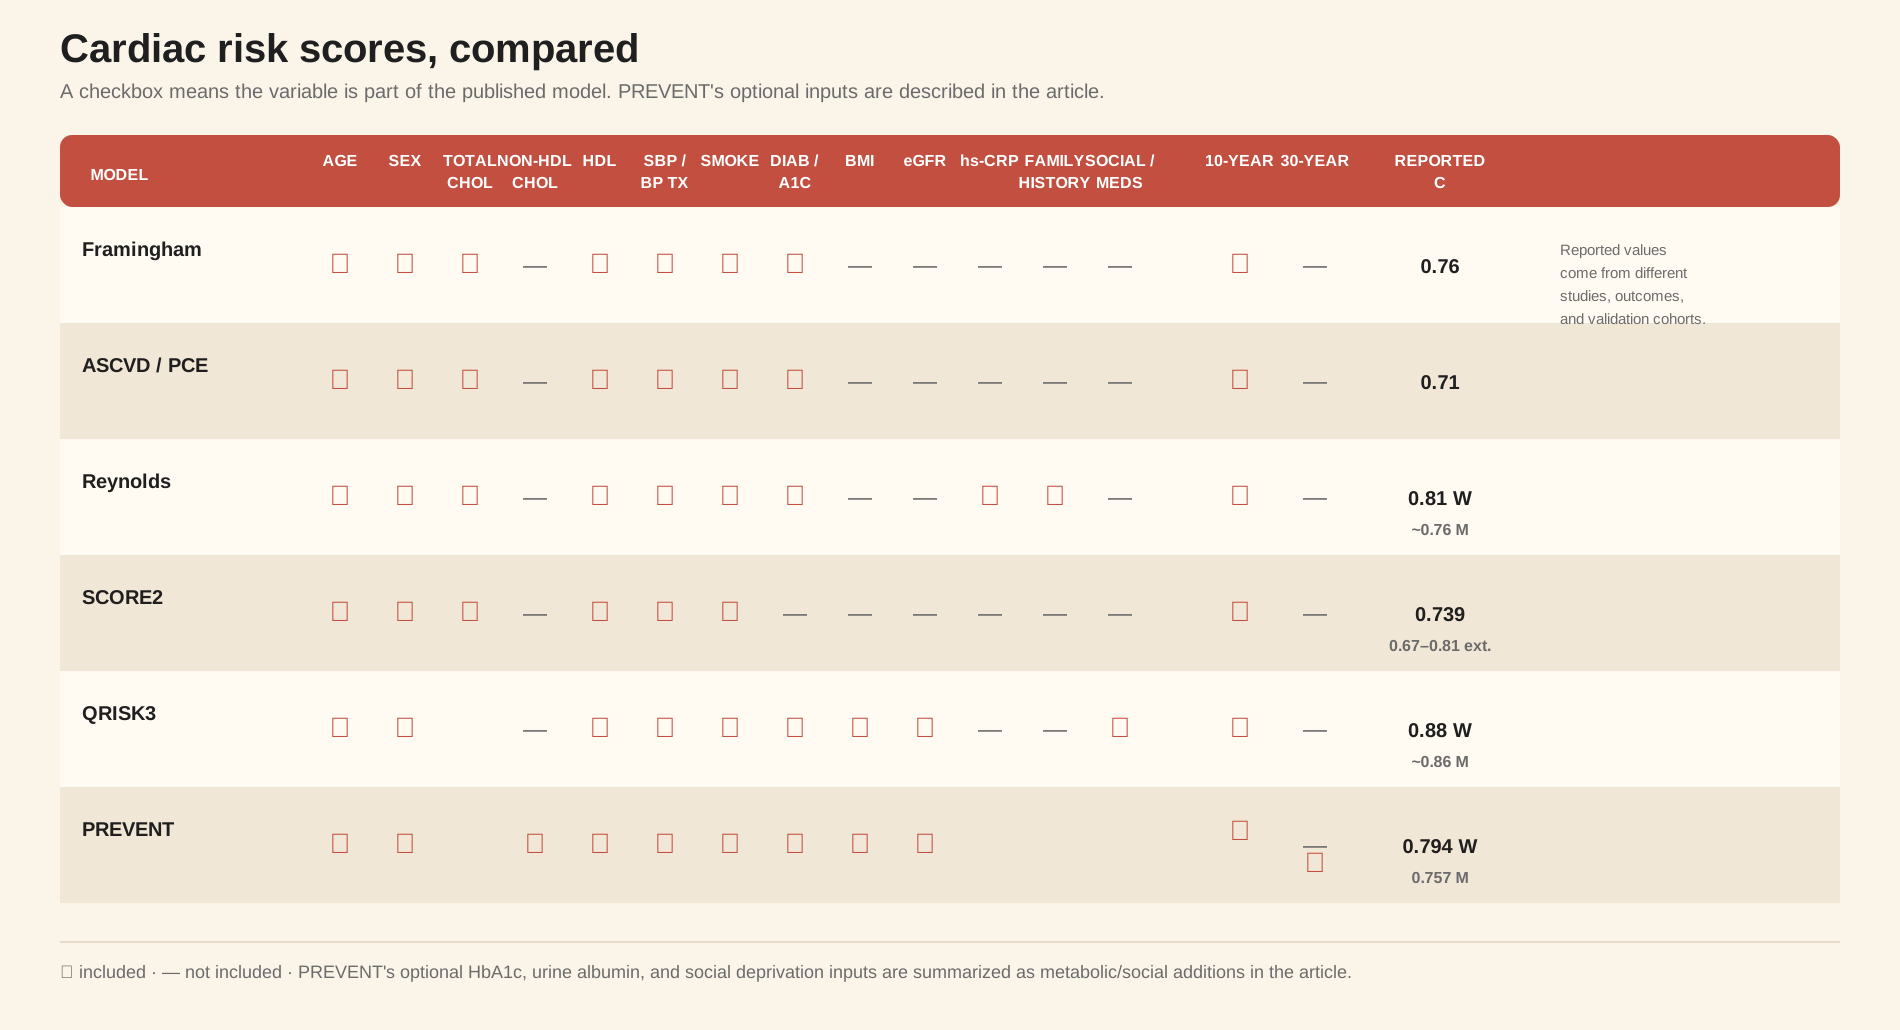 The reported c-statistics come from different cohorts, outcomes, and validation designs. They are useful context, not a head-to-head ranking.
Which risk calculator should you use?
- United States: PREVENT is the current AHA model for adults ages 30–79 without known cardiovascular disease. The Pooled Cohort Equations (ASCVD Risk Estimator) remain common in guidelines and clinical software.
- Europe: SCORE2 is designed for adults ages 40–69 without cardiovascular disease or diabetes. SCORE2-OP extends the framework to older adults.
- United Kingdom: QRISK3 is used in UK primary care for adults ages 25–84.
- Longer view: PREVENT estimates 30-year risk for adults ages 30–59. Some Framingham tools estimate lifetime risk, which isn’t the same as 30-year risk.
- Inflammation or family history: Reynolds adds hs-CRP and parental history, but it was developed in narrower US cohorts and isn’t the default US calculator.
What the major risk calculators actually include
| Model | Typical population and outcome | Inputs | Horizon |
|---|---|---|---|
| Framingham General CVD | US adults; broad CVD outcome | Age, sex, total cholesterol, HDL, systolic BP, BP treatment, smoking, diabetes | 10-year; lifetime variants exist |
| ASCVD / Pooled Cohort Equations | US adults 40–79; heart attack, coronary death, or stroke | Age, sex, race coefficient, total cholesterol, HDL, systolic BP, BP treatment, smoking, diabetes | 10-year |
| Reynolds Risk Score | Initially healthy US women ≥45 and men ≥50; MI, stroke, revascularization, or CV death | Age, sex, total cholesterol, HDL, systolic BP, smoking, diabetes, hs-CRP, parental premature MI | 10-year |
| SCORE2 | European adults 40–69 without CVD or diabetes; fatal and nonfatal CVD | Age, sex, smoking, systolic BP, total cholesterol, HDL; country-risk calibration | 10-year |
| QRISK3 | UK primary-care adults 25–84; CVD | Age, sex, ethnicity, deprivation, smoking, BP, cholesterol/HDL ratio, BMI, diabetes, kidney disease, atrial fibrillation, rheumatoid arthritis, migraine, steroids, antipsychotics, HIV, erectile dysfunction, and other clinical factors | 10-year |
| PREVENT | US adults 30–79 without known CVD; total CVD, ASCVD, and heart failure | Age, sex, non-HDL cholesterol, HDL, systolic BP, BP treatment, smoking, diabetes, BMI, eGFR; optional HbA1c, urine albumin/creatinine ratio, and social deprivation index | 10-year and 30-year |
Head-to-head comparison in UK Biobank
The fairest comparison puts several models on the same people and evaluates them against the same follow-up data. A 2026 study did this for PREVENT, SCORE2, and QRISK3 in 502,157 UK Biobank participants. The sex-specific AUCs were close: 0.743 for PREVENT, 0.737 for SCORE2, and 0.714 for QRISK3 in women; 0.687, 0.683, and 0.682 in men. The models were broadly similar, despite their different inputs and original outcome definitions.
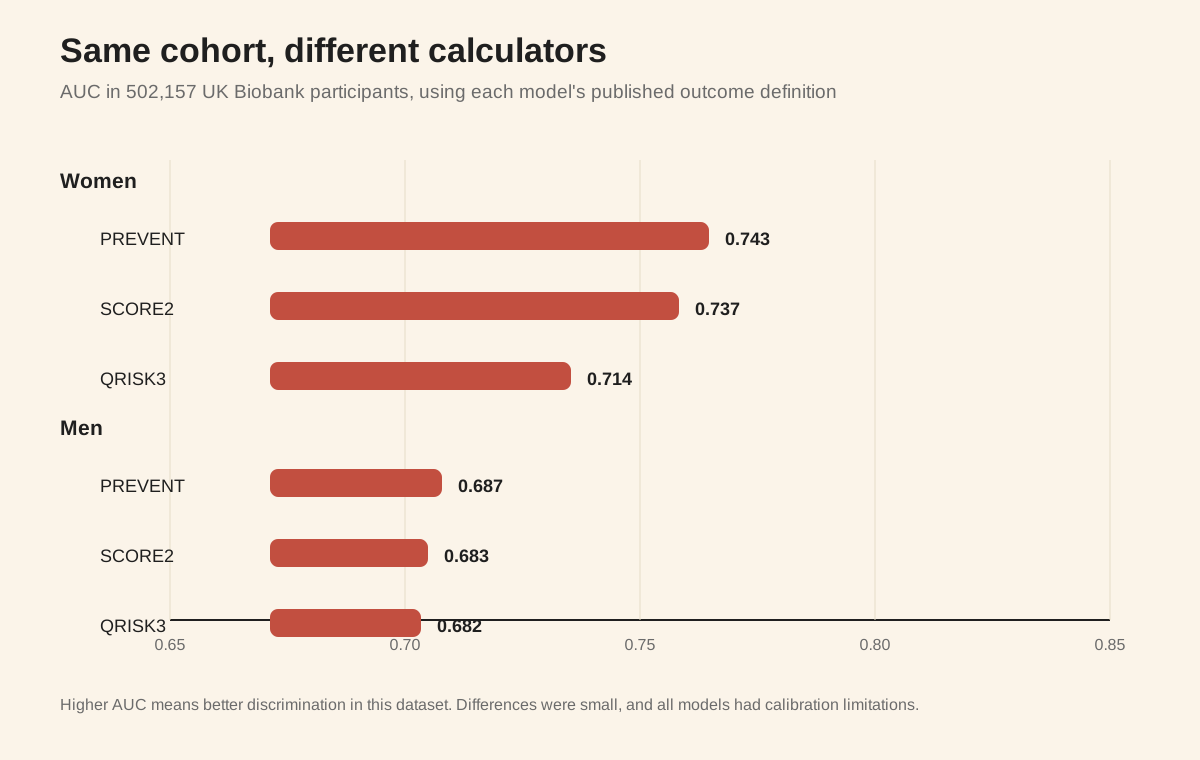 AUCs from the primary complete-case analysis. The study also tested harmonized outcome definitions and found the same general pattern. Source: Kastrati et al., American Journal of Preventive Cardiology, 2026.
This is a useful reality check on the larger numbers reported in many model-development papers. A model can look excellent in its original cohort and only modestly better than its competitors in an independent population. The UK Biobank is also not a perfect stand-in for primary care: participants are unusually healthy and predominantly White, and the investigators rated all three models at high risk of bias.
The models are answering different questions
The ASCVD equations estimate a first atherosclerotic cardiovascular event over 10 years. SCORE2 estimates fatal and nonfatal cardiovascular disease over the same period, with baseline risk recalibrated for European countries. QRISK3 estimates a broader primary-care CVD outcome and includes diagnoses absent from US equations.
PREVENT broadens the question in two ways. It estimates total cardiovascular disease, including heart failure, as well as ASCVD. It also estimates 30-year risk for adults ages 30 to 59. The American Heart Association says PREVENT is validated for adults ages 30–79 without known cardiovascular disease and uses separate outcome-specific equations for total CVD, ASCVD, and heart failure. AHA PREVENT calculator
That longer horizon is useful because a 35-year-old can have substantial lifetime exposure to cholesterol or blood pressure while still facing a low probability of an event before age 45. A low 10-year score doesn’t make those exposures harmless.
Why the input lists differ
The traditional core: age, cholesterol, blood pressure, smoking
Framingham, ASCVD, SCORE2, and PREVENT all use some version of this core. The variables are easy to measure and were available in the cohorts that built the models.
The exact cholesterol input varies. ASCVD uses total cholesterol and HDL. SCORE2 uses the same two values. PREVENT uses non-HDL cholesterol and HDL, which captures cholesterol carried in LDL and other atherogenic particles without requiring an LDL estimate.
None of these core models directly measures ApoB, Lp(a), or hs-CRP. Those markers can reveal risk that a traditional calculator does not see. Our ApoB guide explains why particle number can differ from LDL cholesterol, and our hs-CRP analysis covers inflammatory risk.
PREVENT adds kidney, metabolic, and social variables
PREVENT includes BMI and estimated glomerular filtration rate in its base equations. Its optional full model can add hemoglobin A1c, urine albumin-to-creatinine ratio, and a social deprivation index. This is why PREVENT needs more information than the older Pooled Cohort Equations.
Those additions aren’t automatically better everywhere. They can improve calibration in the population where the model was built, but accuracy can fall when the model moves to another health system or country.
QRISK3 includes the medical record
QRISK3 is the outlier in the comparison. Along with standard measurements, it includes ethnicity, a deprivation score, BMI, family history, chronic kidney disease, atrial fibrillation, rheumatoid arthritis, migraine, systemic lupus, severe mental illness, steroid use, antipsychotic use, HIV, erectile dysfunction, and blood-pressure variability, among other variables. Original QRISK3 study
That breadth makes QRISK3 useful in UK primary care, but harder to reproduce from a blood panel. It’s a medical-record model, not a biomarker-only score.
Reynolds adds inflammation and family history
The Reynolds Risk Score was designed to test whether hs-CRP and parental history added information to traditional risk factors. In the original women’s validation cohort, the c-statistic was 0.81. A companion study evaluated men. Reynolds Risk Score in women, Reynolds Risk Score in men
Reynolds shows how a model can add a biomarker from a different biological pathway. It was developed in selected US cohorts, so its reported performance doesn’t automatically transfer to everyone.
What is a c-statistic, and why can’t we rank these models from it?
The c-statistic measures discrimination: how often a person who experiences an event receives a higher predicted risk than a person who does not. A value of 0.5 is random ordering; 0.8 means the model ranks the eventual event higher about 80% of the time across comparable pairs.
The number depends on the sample and endpoint. A wide spread of ages and risk factors can make discrimination look stronger than it does in a narrow, low-risk population. Predicting heart failure, all CVD, and a coronary event are different tasks.
Calibration is separate. A model can rank people correctly while predicting risks that are too high or too low. External studies show that both calibration and discrimination change across health systems and countries.
Can anything predict events better?
Yes, but the better predictors are usually more expensive, less available, or harder to use for routine screening. In the CAC Consortium, adding coronary artery calcium to the Pooled Cohort Equations raised the C-statistic to about 0.80 for cardiovascular death and 0.82 for coronary death, with the largest gains in people at borderline or intermediate calculated risk. CAC Consortium comparison Coronary CT angiography can go further by measuring plaque burden, stenosis, and high-risk plaque features: in the PROMISE trial, a CT-based classification had a C-statistic of 0.776 for a composite cardiovascular outcome, compared with about 0.63 for the clinical score alone and 0.68 after adding CAC. PROMISE CT angiography analysis
That doesn’t mean everyone should have a CT scan. The studies used different populations and endpoints, and the PROMISE participants had symptoms that prompted evaluation. More detailed imaging, repeated measurements, genetic scores, and machine-learning models may improve prediction further, but the gains aren’t automatically transferable to a healthy screening population or to better clinical outcomes.
There is no known universal “fundamental limit” of 0.81. In principle, a model with complete information about a person’s arteries, exposures, treatments, and competing illnesses could discriminate much better. In practice, plaque rupture is partly unpredictable, measurements are noisy, risk factors and treatments change over time, and non-cardiovascular deaths can prevent a cardiac event from occurring. These sources of uncertainty limit real-world prediction, but competing risks do not impose one fixed C-statistic ceiling.
Why a risk score is not the same as an artery scan
These models estimate future clinical events from risk factors. None directly measures whether plaque is already present. A coronary calcium scan measures calcified coronary plaque. Coronary CT angiography can see noncalcified plaque. Carotid and femoral ultrasound can detect plaque outside the heart.
That distinction explains why a young person can have visible plaque and a low 10-year score. The score is answering “How likely is an event soon?” The scan is answering “Is there disease in the artery now?” Neither answer replaces the other.
What to use in practice
Start with the model calibrated to your country and clinical setting. Use PREVENT in the US when your clinician has the required information, SCORE2 in Europe, and QRISK3 in the UK. Treat the resulting percentage as an estimate, not a diagnosis.
If a treatment decision is uncertain, risk-enhancing information can help: ApoB, Lp(a), hs-CRP, family history, kidney function, diabetes, and sometimes coronary calcium. The useful test is the one that could change what you do.
If you’re young, look at the 30-year or lifetime view when available. A low 10-year number can reflect the short time window, not a low lifetime burden of exposure. The percentage becomes more useful when you know what went into it, what it predicts, and what it leaves out.
Get your free 30-day heart health guide
Evidence-based steps to optimize your heart health.