Today, an FDA advisory committee will review Grail’s application for approval of Galleri, a blood test that screens for signals of more than 50 types of cancer.
The appeal of Grail is obvious. Current screening guidelines test just four types of cancer—breast, colon, cervical, and lung—leaving 65% of cancers without a test. But one reason doctors hesitate is false positives. A cancer signal can lead to scans and biopsies even when no cancer is found. As oncologist Kenneth Kehl put it, “False positives cause anxiety and lead to additional testing that may carry its own risks”.
I “did the math” on true positives (cancers caught), false negatives (cancers missed), and false positives (positive results without cancer). I was surprised by how favorable adding Galleri looked in this model. For ages 65–74, adding Galleri produces 2.5× as many detections for women and 5.8× for men, with false positives increasing 5.5% and 28%, respectively, compared to current screening. (These are modeled detections, not estimates of lives saved.)
Here’s a walkthrough of how I derived those numbers.
Current guidelines screen for four cancers
As the saying goes, “don’t compare to the Almighty, compare me to the alternative.” In the US, screening guidelines are largely set by the US Preventive Services Task Force (USPSTF). By law, any screening given an A or B rating by the USPSTF must be covered by insurance.
Today, the USPSTF recommends screening for four types of cancer: breast, colon (starting at age 45), cervical, and lung (for smokers). Even within these four categories, there are gaps since colon cancer is increasingly common in young people.
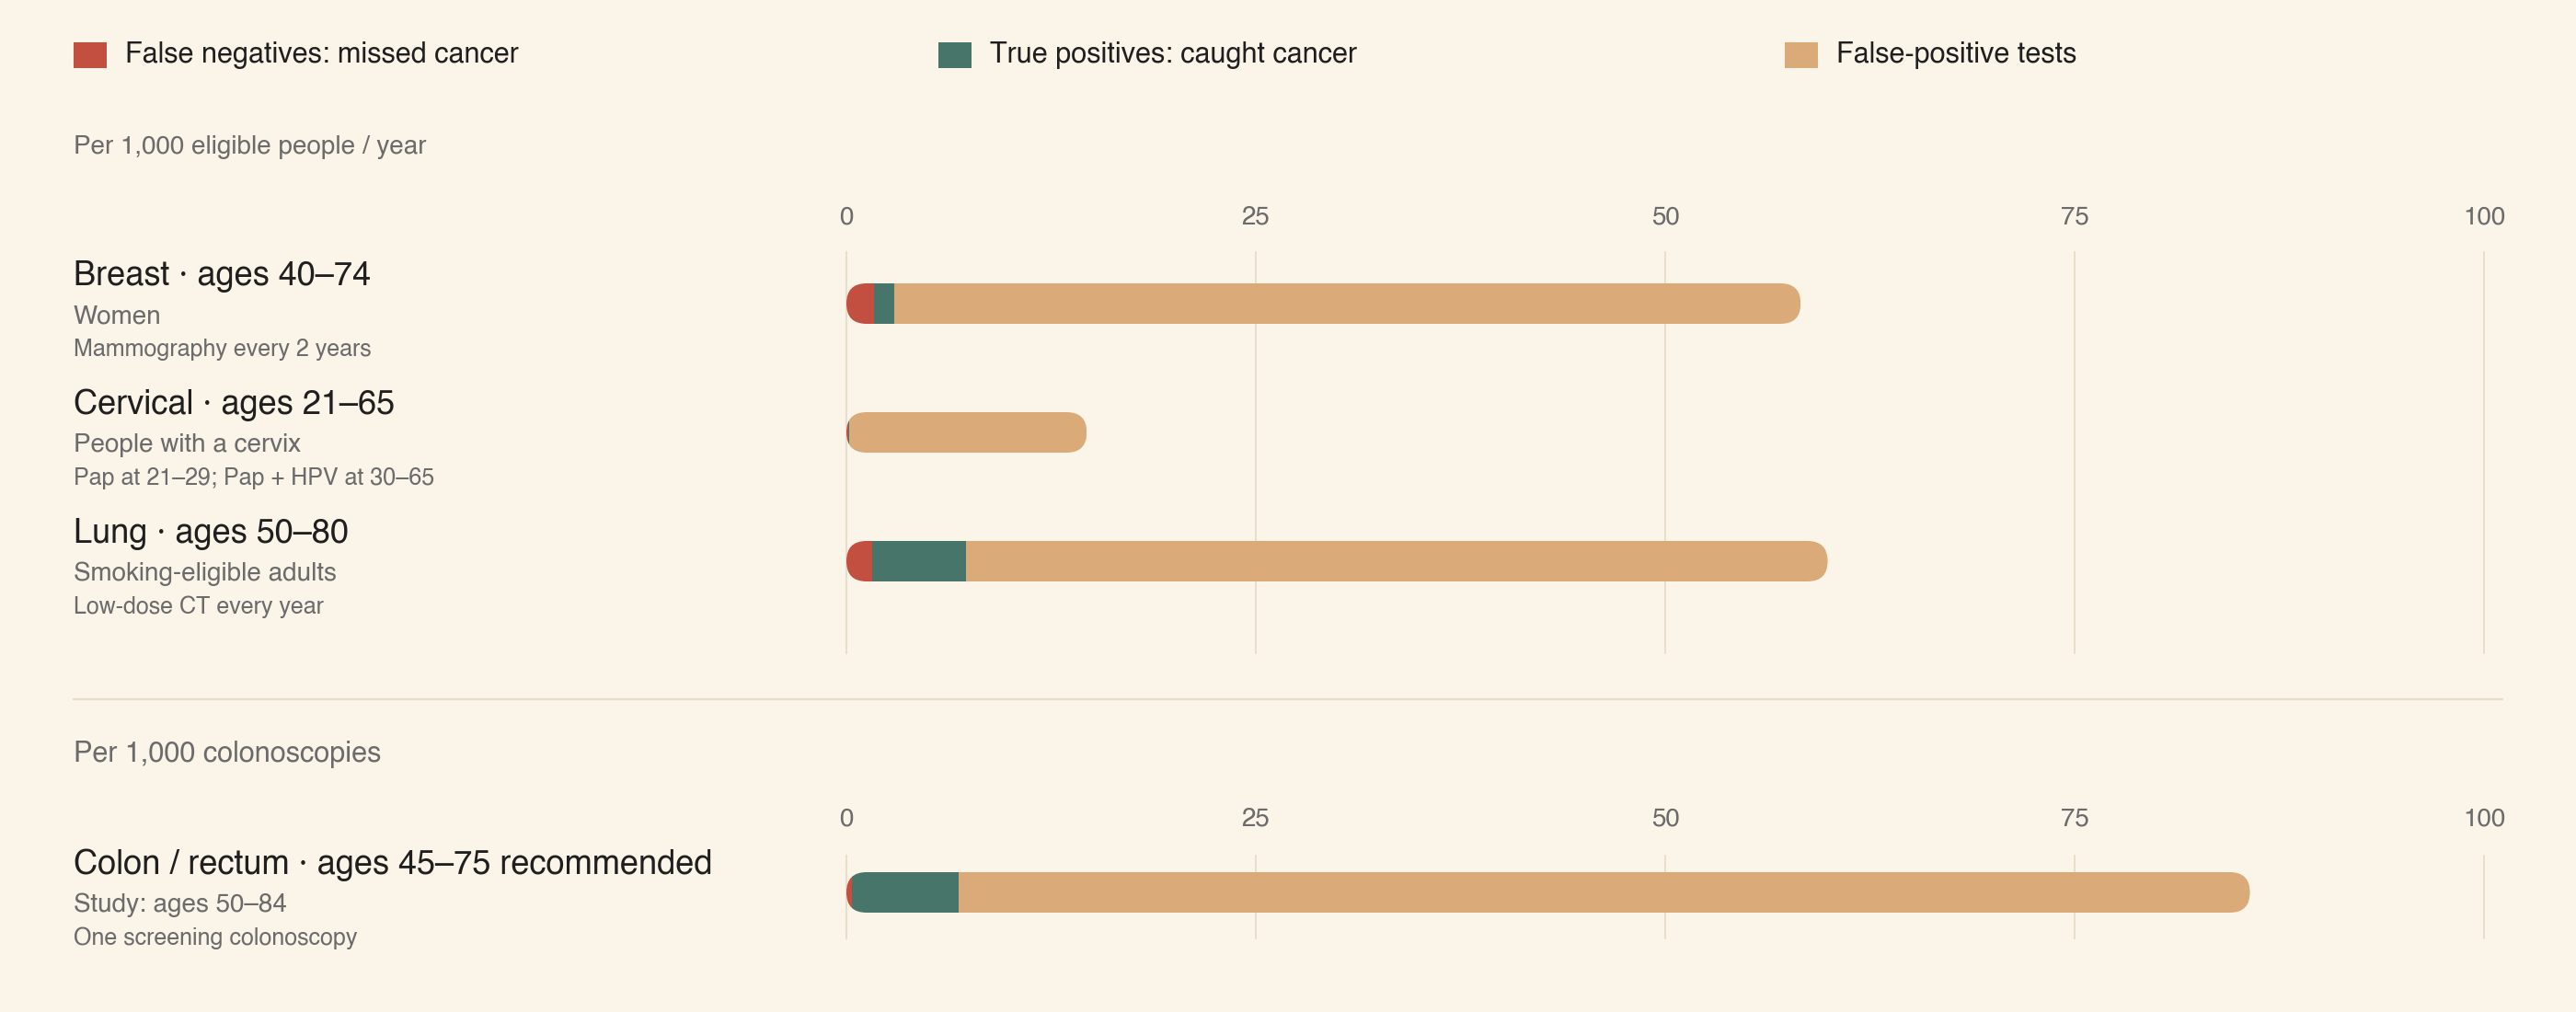
The comparison below uses colonoscopy for colorectal screening and counts precancerous polyps as beneficial findings, not false positives. Colonoscopy’s per-exam results above are distinct from the annual program estimates below. Numbers and assumptions.
Galleri’s accuracy ranges from 0% to 93.5%, and is highest for cancers with no current screening
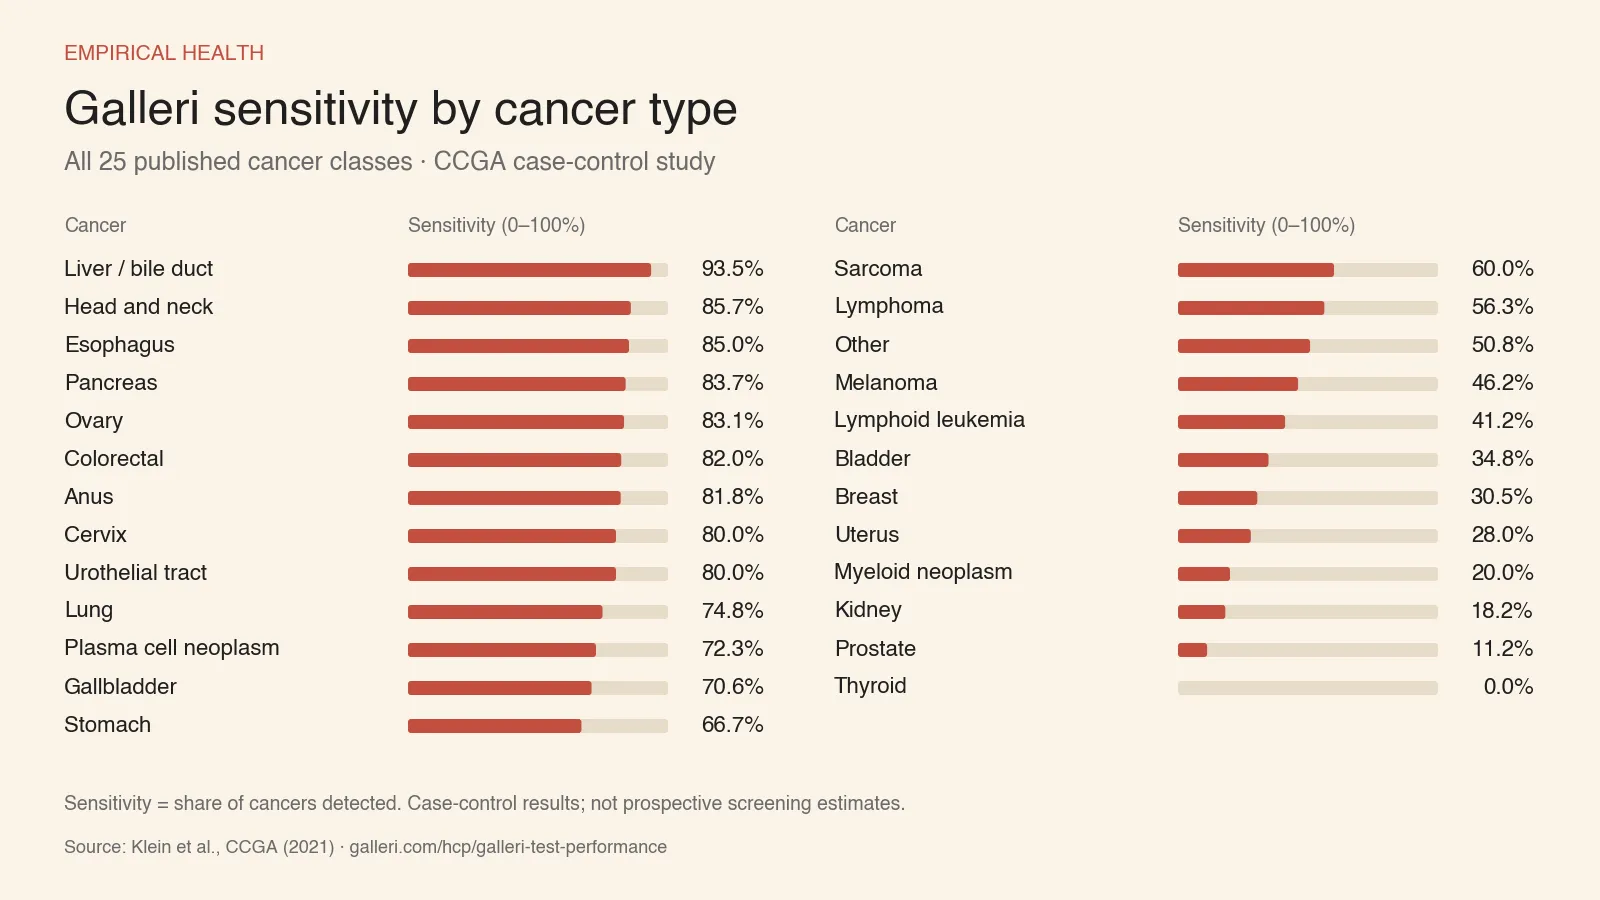
Galleri’s sensitivity (the share of cancers it detects) ranged from 0% for thyroid cancer to 93.5% for liver and bile-duct cancer in the CCGA case-control study, with 51.5% sensitivity overall. Galleri’s highest sensitivities were for liver/bile-duct, head-and-neck, esophageal, pancreatic, and ovarian cancers. All of these lack routine USPSTF screening. (The 0% thyroid figure is the observed study sensitivity, not proof that the test can never detect thyroid cancer).
(In the later prospective PATHFINDER 2 study, Grail’s MCED-V2 detected 39.3% of cancers diagnosed within the following year, with a 0.4% false-positive rate among people without cancer.)
Sources and screening eligibility
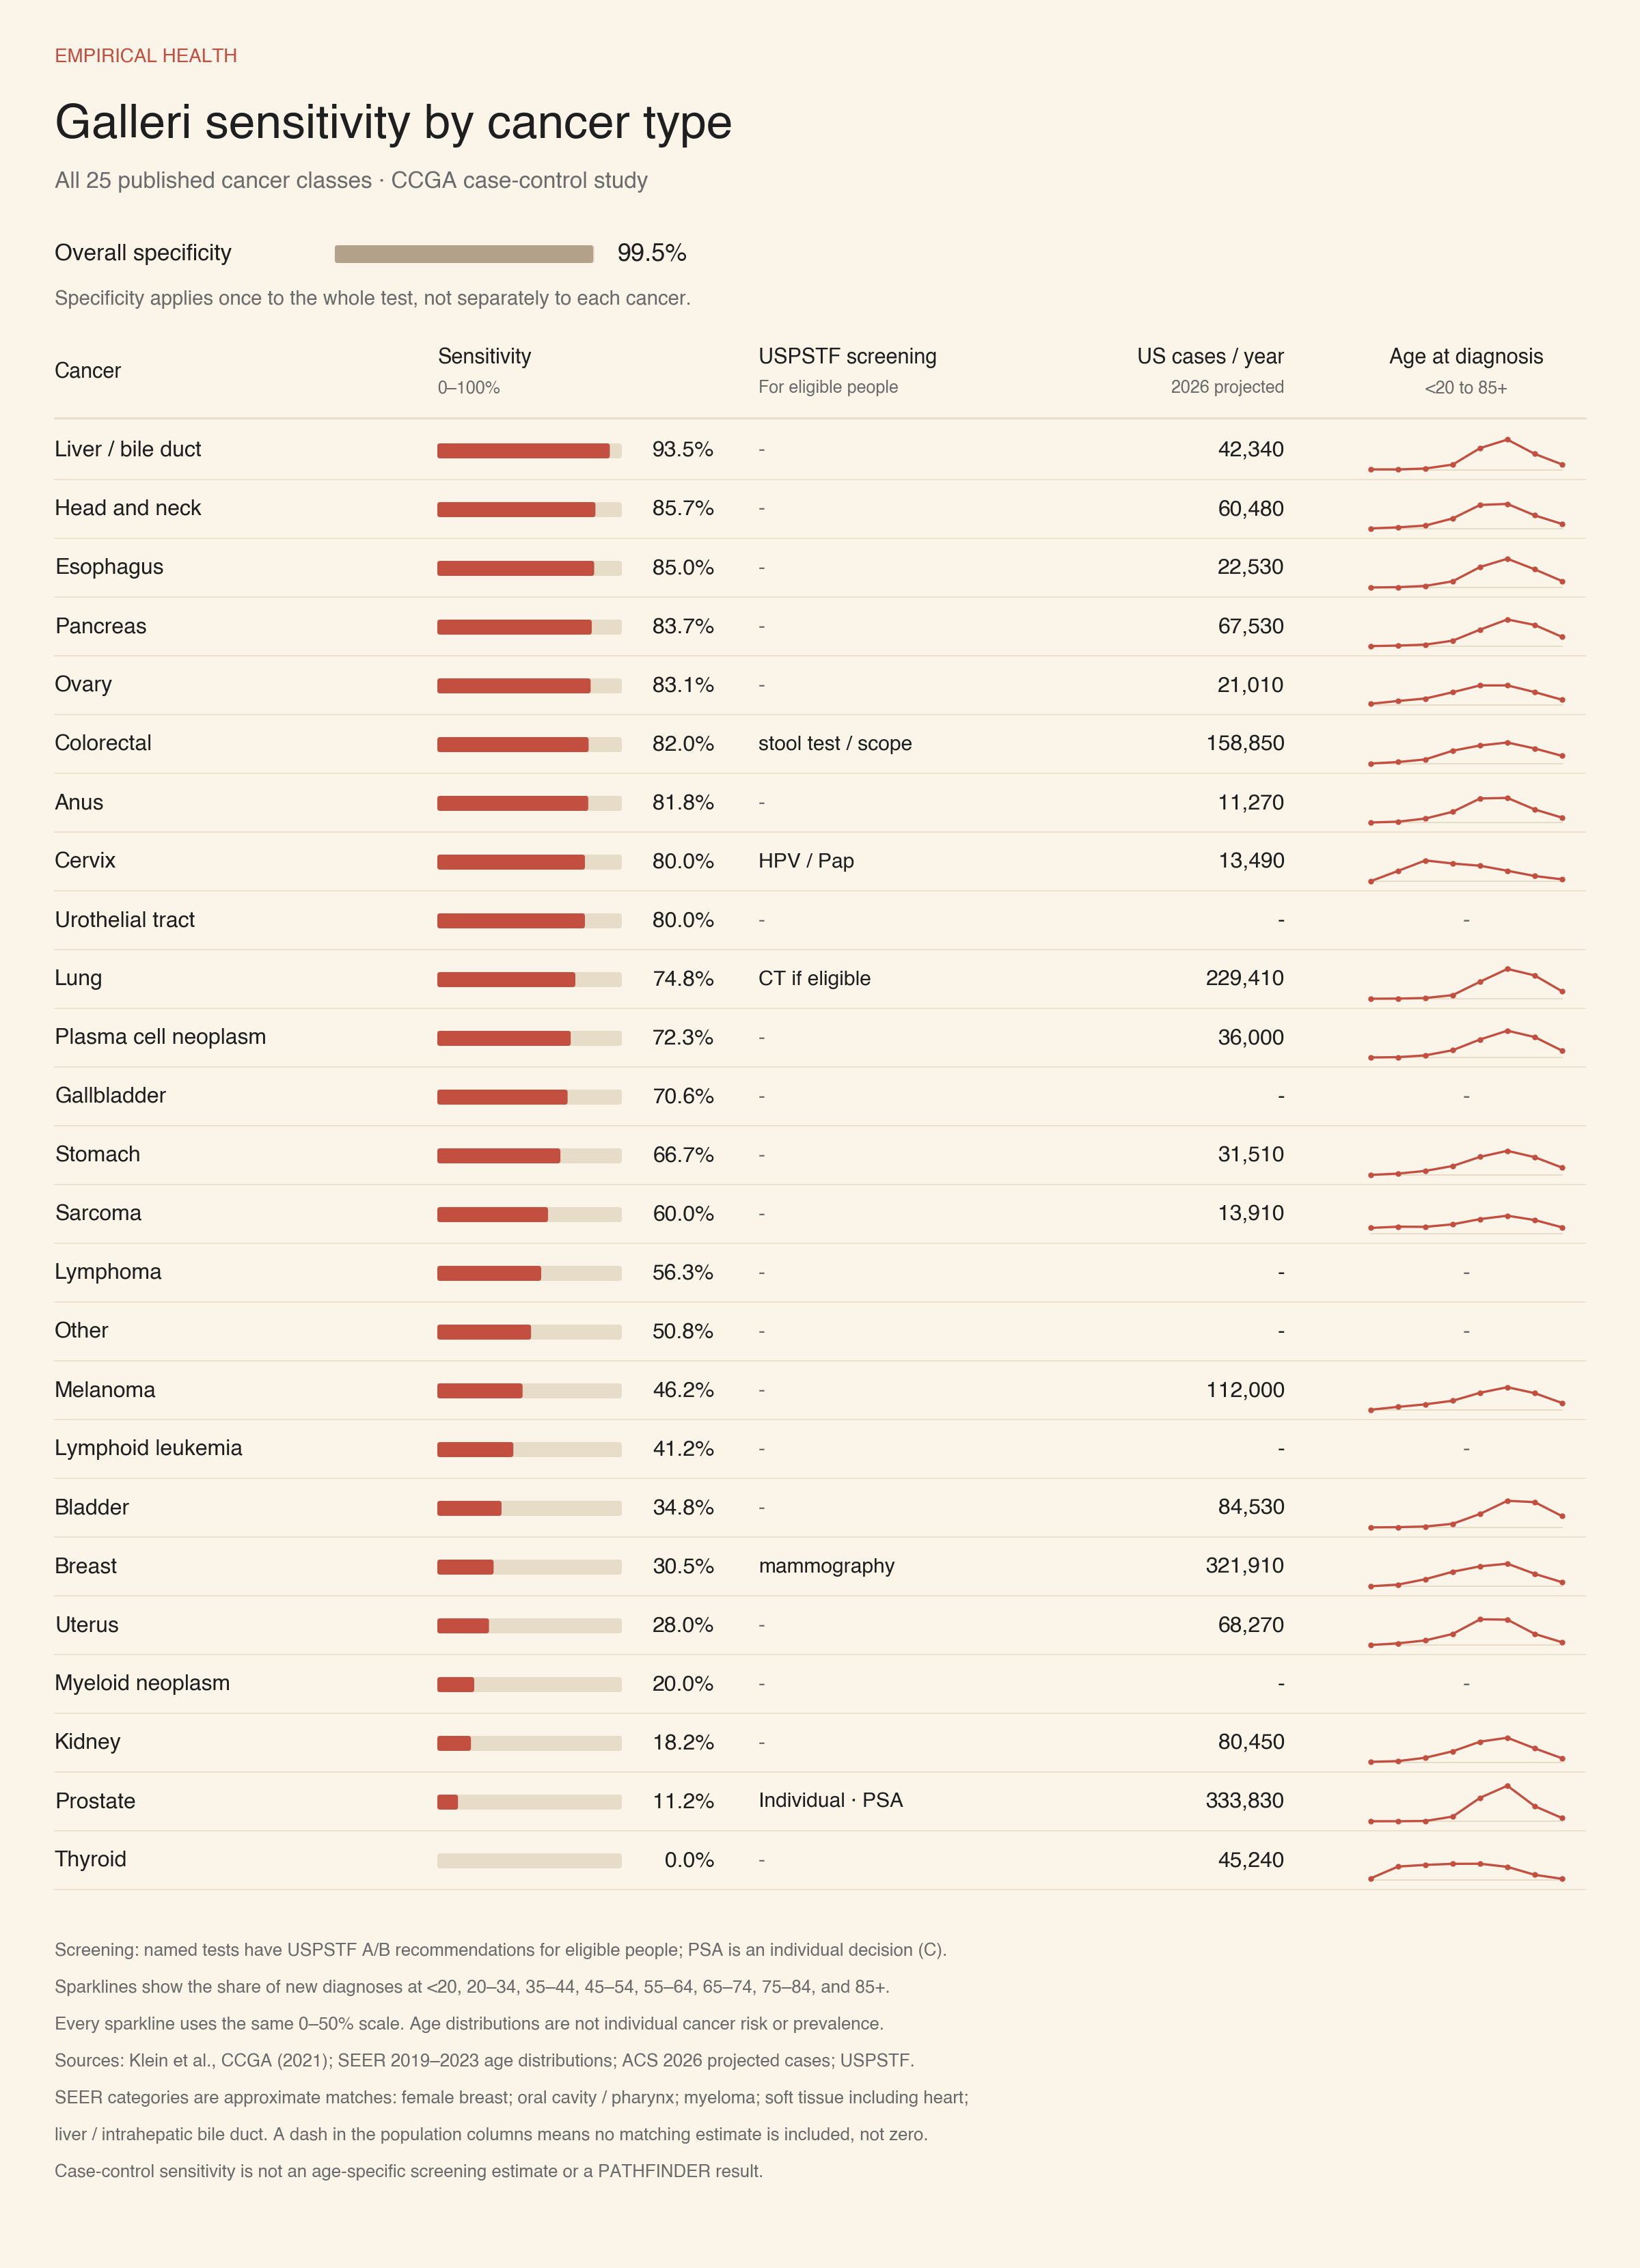
Sources: complete CCGA sensitivity table; SEER 2019–2023 age distributions and ACS 2026 projected cases. Population categories are approximate matches, as noted in the image. A dash in the population columns means no matching estimate is included, not zero cases.
USPSTF: breast, ages 40–74; cervical, 21–65; colorectal, 45–75 (selectively 76–85); lung, 50–80 with a qualifying smoking history; PSA, individual decision at 55–69.
SEER population data: Liver / bile duct; Head and neck; Esophagus; Pancreas; Ovary; Colorectal; Anus; Cervix; Lung; Plasma cell neoplasm; Stomach; Sarcoma; Melanoma; Bladder; Breast; Uterus; Kidney; Prostate; Thyroid.
The PATHFINDER 2 cancer map in the appendix shows which cancer types and stages were actually found or missed in the prospective study.
This chart preserves all 25 published CCGA cancer classes, alongside screening eligibility, annual US case estimates, and age distributions where available. CCGA was a case-control study; its subtype estimates are not PATHFINDER’s prospective screening results. Complete CCGA sensitivity table.
The revised assay under FDA review was designed to reduce false positives, with a tradeoff in sensitivity. In the paired PATHFINDER 2 comparison, false positives fell from 0.36% to 0.15%, while sensitivity fell from 38.9% to 35.0%. Those figures describe participants evaluated with both versions; the earlier 39.3% result uses a different analysis population. Our main model retains the earlier assay assumptions. GRAIL briefing, p. 104, Table 34. The appendix compares versions and explores the revised assay separately.
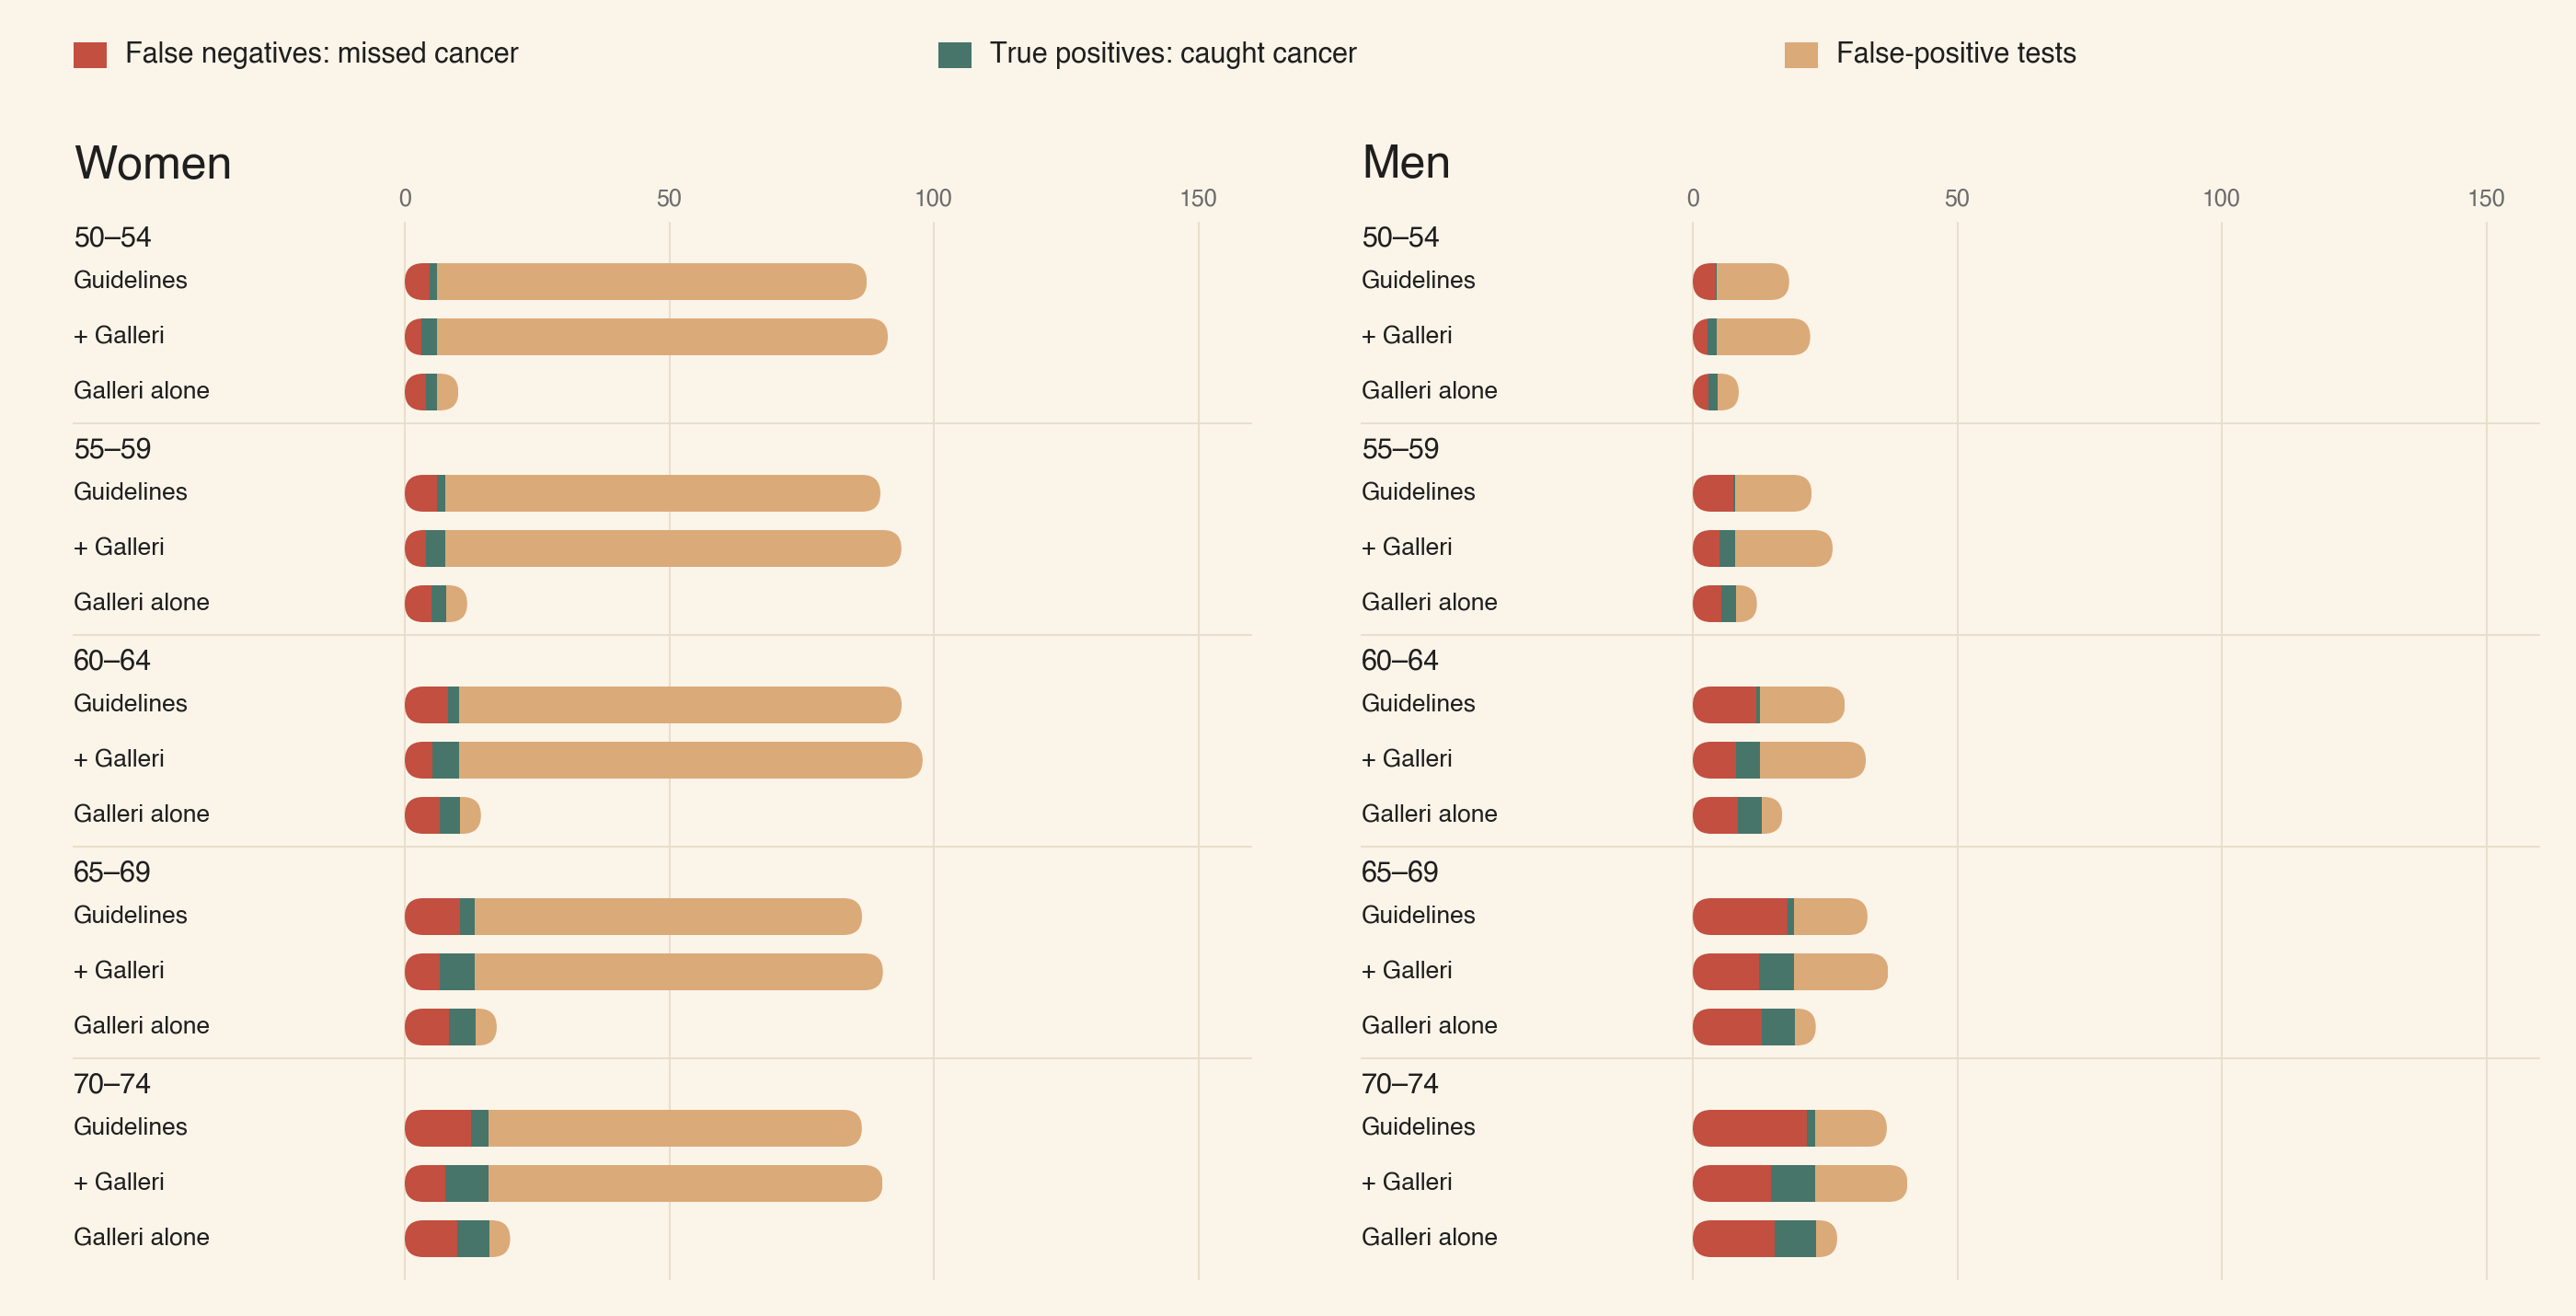
Adding Galleri produces 2.5× as many detections for women and 5.8× for men aged 65–74
For 1,000 adults aged 65–74, our model estimates that adding Galleri would catch roughly four additional cancers annually in women and six in men, while producing about four additional false positives. These are illustrative estimates; the model has not been validated for these age groups.
The main calculation uses a colonoscopy-based baseline: colonoscopy every ten years, annual eligible lung CT, biennial mammography, and five-year cervical cotesting when applicable. The second policy adds annual Galleri; the third uses annual Galleri alone. All three assume full adherence. The chart combines ages into 30–49 (illustrative), 50–64, and 65–74 using population weights; the examples below use the same population-weighted age bands. The chart shows total outcomes under each policy, not just Galleri’s incremental contribution.
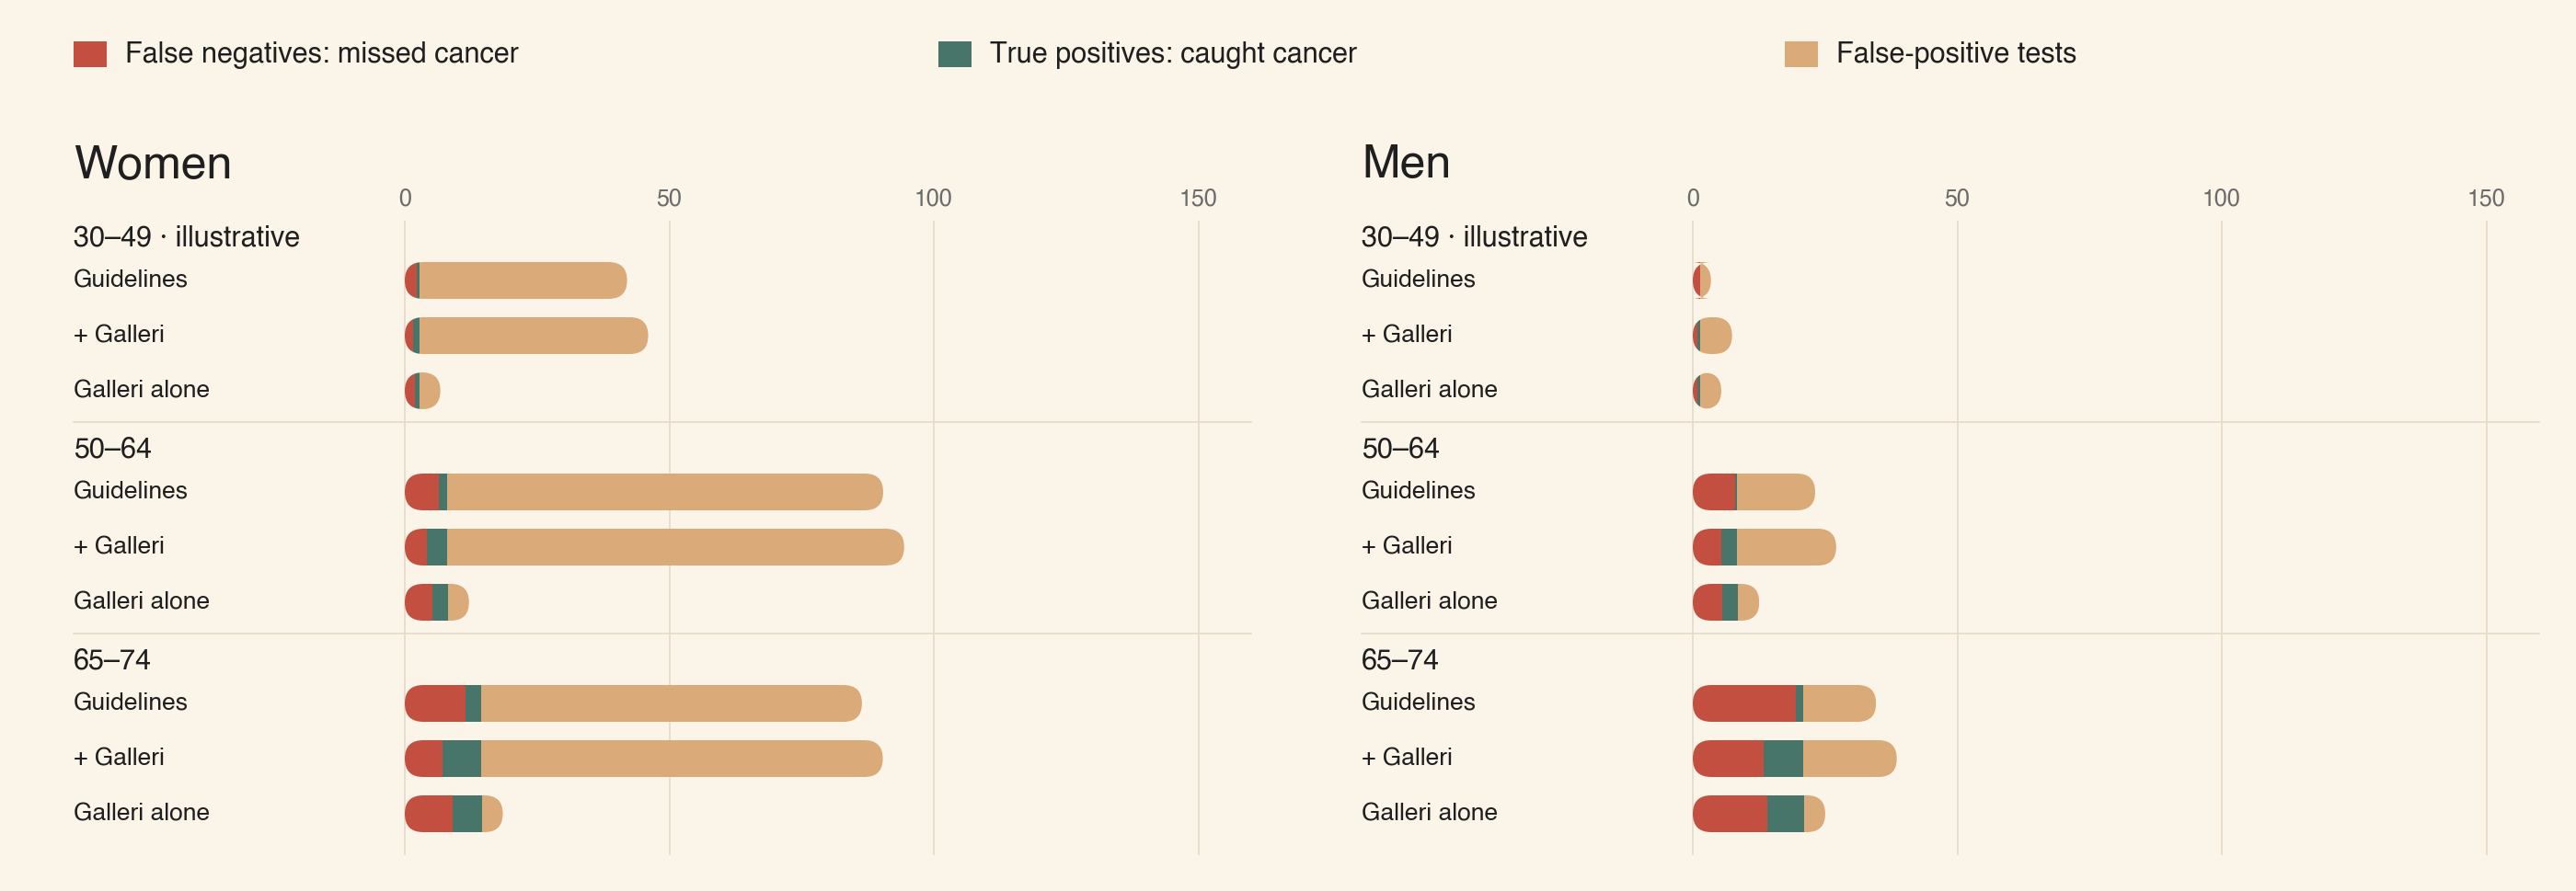
The model assumes colonoscopy prevents an additional 20% of colorectal cancers relative to observed US incidence, with 0% and 40% alternatives in the appendix. This is a crude mature-program assumption, not a measured effect. Both colonoscopy policies receive the same prevention benefit, counted separately from caught and missed cancers. “Galleri alone” receives no modeled prevention and is not a substitute for recommended screening. “Missed” includes cancers outside screening’s scope, which may later be diagnosed after symptoms. False positives count test results, not distinct people or biopsies; the full pill is therefore not a count of unique people.
Age changes the absolute benefit in the central scenario
For 1,000 women aged 65–74, modeled cancer detection rises from about 3.0 to 7.3 per year; missed cancers fall from 11.4 to 7.1. False-positive tests/interventions rise from approximately 72 to 76.
For 1,000 men aged 65–74, detection rises from 1.3 to 7.4; missed cancers fall from 19.6 to 13.4. False-positive tests/interventions rise from approximately 14 to 18.
That’s 2.5× as many detections for women and 5.8× for men, with false positives increasing 5.5% and 28%, respectively. The percentages use unrounded model values. They describe changes in test/intervention counts, not the percentage of people experiencing a false positive. The larger multiplier in men partly reflects a smaller baseline screening yield, including the exclusion of PSA. Both colonoscopy policies also prevent an assumed 0.20 cancers per 1,000 women and 0.29 per 1,000 men annually, reported separately from detection.
On these two measures alone, adding Galleri looks attractive. The unanswered question is how many additional detections change treatment or survival enough to justify the test and its follow-up. Counting every detected cancer as an equal benefit cannot answer that.
A positive result can lead to scans, invasive procedures, and weeks of follow-up, whether or not cancer is ultimately found.
How much does the prevention assumption matter?
The colonoscopy appendix documents the crude annual model used above. It tests assumed additional reductions in colorectal cancer incidence of 0%, 20%, and 40%, and counts prevented cancers separately from cancers caught or missed. Those reductions are hypothetical adjustments to observed US incidence, which already reflects some screening—not estimates of colonoscopy’s total preventive effect. The model assumes a mature program and does not simulate the years before prevention takes effect.
73.4% of Galleri positives underwent an invasive follow-up
In the PATHFINDER 2 paper published in Nature Medicine on September 22, 213 of 290 positive-test participants who underwent diagnostic evaluation (73.4%) had at least one invasive procedure. That includes both true and false positives; across all 35,335 participants in the safety analysis, the proportion was 0.6%. These follow-ups used the earlier MCED-V2 assay, not the revised assay under FDA review.
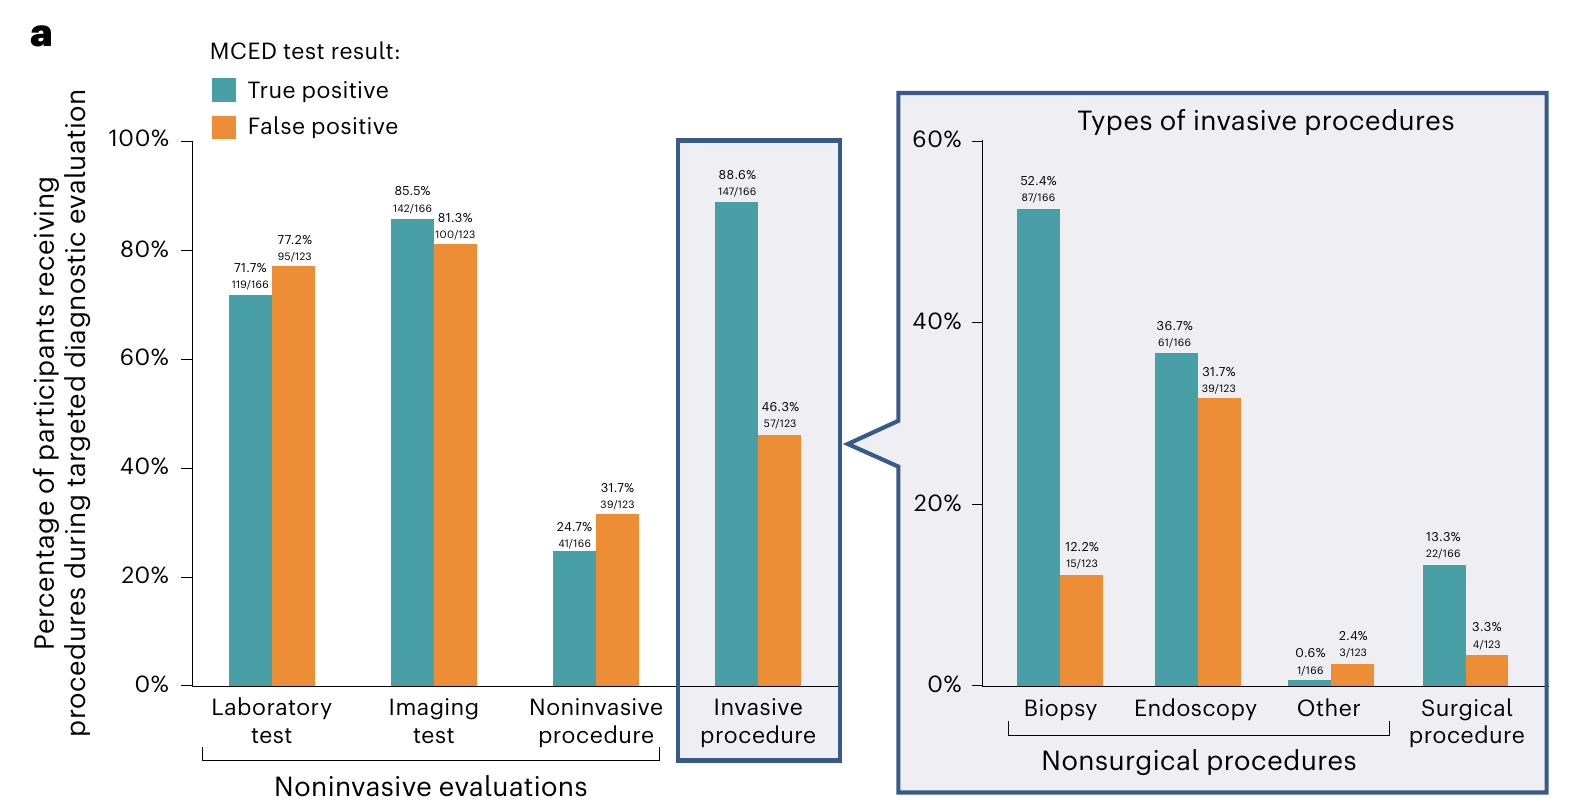
Figure 2a shows the narrower targeted diagnostic workup: 88.6% of true positives (147/166) and 46.3% of false positives (57/123) underwent an invasive procedure. Most invasive procedures across the full evaluation were nonsurgical (90.5%), and no serious study-related adverse events were reported at the analysis cutoff. The practical tradeoff is that even a false alarm can mean a biopsy or endoscopy—not just another blood draw. Figure 2a and Table 3.
Methodology and caveats
What did Galleri actually find in PATHFINDER 2?
The study assigned 173 cancers to Galleri detection, 31 to USPSTF grade A/B screening, and 60 to grade C screening. Another 176 were found through incidental findings, symptoms, surveillance, or other routes during the first year. PATHFINDER 2, Figure 3a.
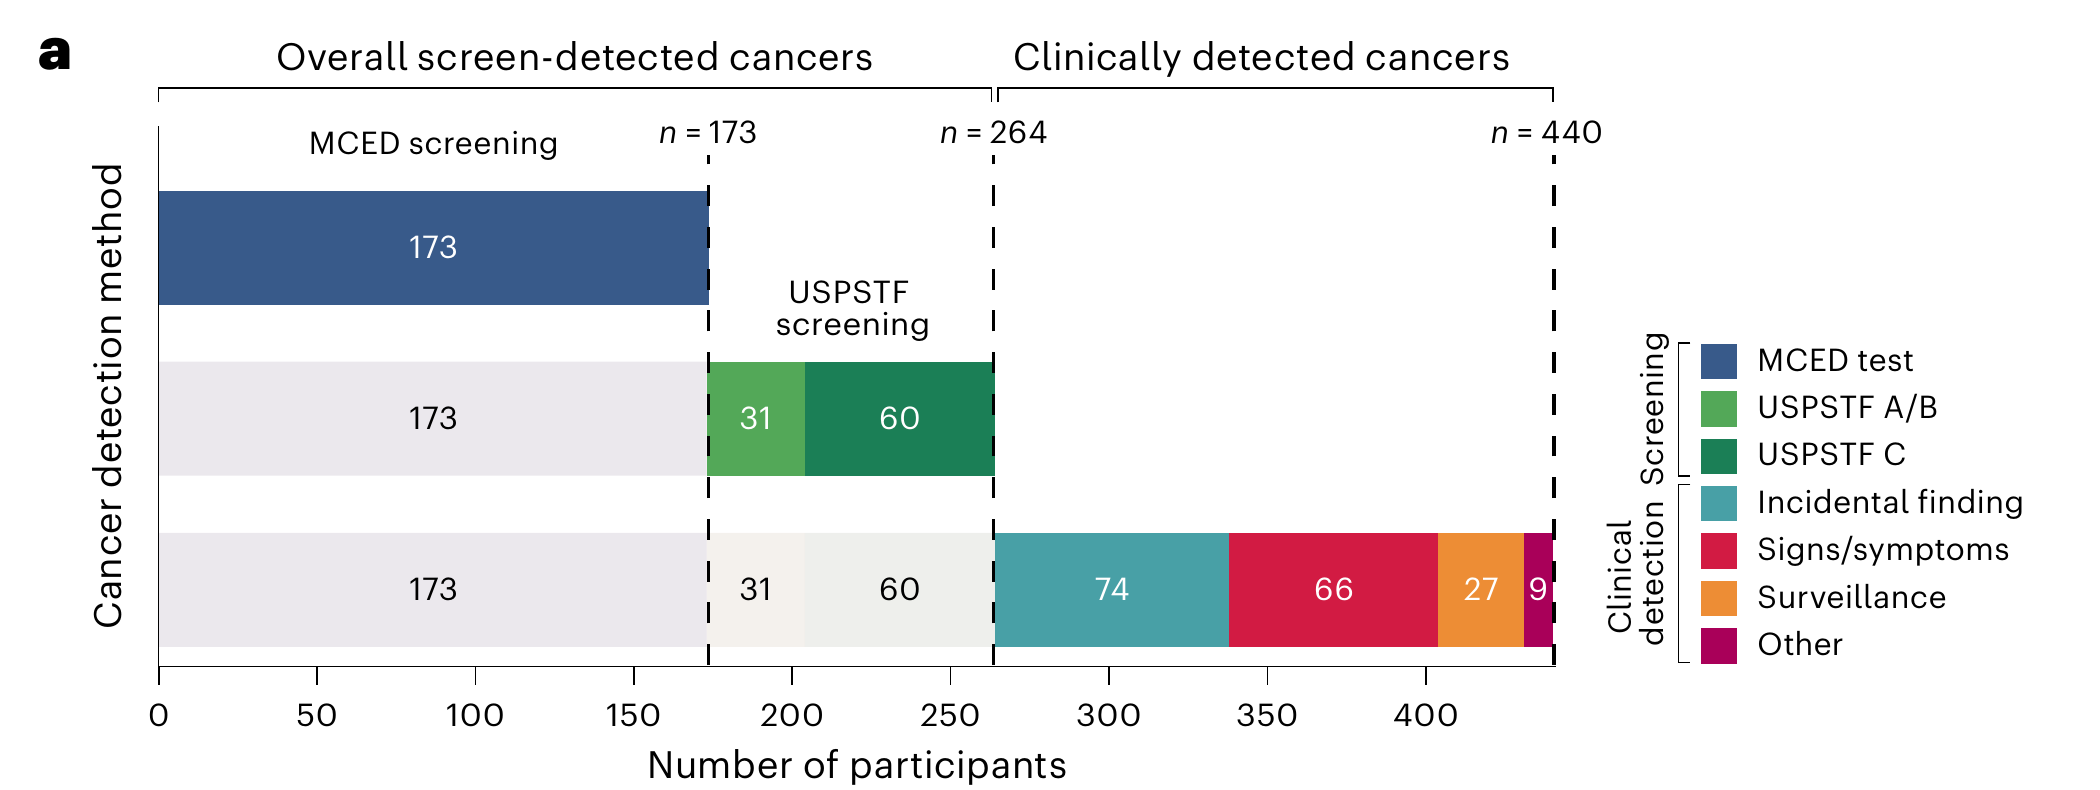
These are observed detection routes, not a randomized comparison: the figure assigns each participant to one route and gives true-positive Galleri results to the Galleri group. It does not establish that all 173 Galleri-detected cancers would otherwise have escaped screening.
How does the model compare with observed trial results?
The trials support additional detection, but their multipliers differ from our age scenarios:
| Evidence | Screen-detected cancers with versus without Galleri | What the comparison measures |
|---|---|---|
| PATHFINDER 2 | 204 versus 31; approximately 6.5× as reported | Detection routes within one cohort over 12 months; no randomized control group |
| NHS-Galleri | 1,173 versus 290; approximately 4.0× | Randomized trial arms across three annual screening rounds |
| Our model, ages 65–74 | 2.5× for women; 5.8× for men | Population-weighted annual colonoscopy-based scenarios with full adherence |
PATHFINDER’s 173 Galleri detections among 32,007 evaluable participants equal 5.4 per 1,000, including recurrent cancers. The 151 new primary cancers equal 4.7 per 1,000. These route-based counts are not a randomized estimate of cancers that would otherwise have escaped screening. PATHFINDER fact sheet; ASCO abstract.
In NHS-Galleri, the intervention arm had 937 Galleri detections plus 236 from usual screening. Its 883 additional screen-detected cancers relative to control are a trial-period count, not an annual rate. NHS-Galleri fact sheet.
This is a benchmark, not a calibration. The populations, prior screening, attendance, cancer definitions, and follow-up differ. A larger trial multiplier does not establish that our model is conservative. Matching the trial’s age-specific inputs and outcomes would be necessary to validate our estimates. Trial benchmark calculations (including the earlier FIT model).
The assumptions that matter most
The model combines SEER’s age- and sex-specific incidence with published test performance and recommended intervals. Three assumptions materially affect detection:
- How long a cancer is detectable before symptoms. The central scenario assumes one year for every cancer and test. A longer window gives screening more opportunities to find it.
- Galleri’s performance in each cancer type. We scale CCGA subtype sensitivities by 39.3/51.5, using the lower overall PATHFINDER result. This is an unvalidated adjustment; episode sensitivity and per-test sensitivity are different quantities.
- Which cancers both methods find. The central scenario assumes independent detection within each cancer type. The downloadable results also calculate the range allowed by different amounts of overlap.
For example, changing only the detectable window produces these percentages of cancers caught at 65–69:
| Assumed detectable period | Women: guidelines | Women: + Galleri | Men: guidelines | Men: + Galleri |
|---|---|---|---|---|
| Six months | 10.4% | 27.1% | 2.9% | 18.2% |
| One year | 20.7% | 50.5% | 5.8% | 34.7% |
| Two years | 36.5% | 74.7% | 7.4% | 50.0% |
These are scenarios, not confidence intervals. Other assumptions include lung-screening eligibility and cervical non-cancer positivity. The model includes a crude colorectal-prevention adjustment but omits prevention from other precancer treatment, overdiagnosis, stage shifts, mortality, and costs. Detection percentages use cancers remaining after modeled prevention. Colonoscopy’s false-positive endpoint excludes precancer, while cervical positivity remains cancer-only; false-positive counts are not equivalent measures of harm. A false-positive count also treats very different follow-up procedures alike.
The appendix retains FDA-based sensitivity analyses of the earlier FIT baseline, including wide uncertainty intervals; those numerical results are separate from the colonoscopy model.
Full methods and sources, central age-band estimates, and prevention and timing scenarios document the inputs, formulas, and limitations.
Does finding more cancer help people live longer?
Additional detection can matter enormously if it enables effective treatment sooner. It can also move the date of diagnosis forward without changing the date of death. That is why the detection chart alone cannot settle whether to get tested.
The randomized NHS-Galleri trial tested whether adding Galleri reduced stage III/IV diagnoses across 12 prespecified cancer types. Its primary result was an incidence rate ratio of 1.03 (95% CI 0.92–1.14; p = 0.6324): an estimated 3% increase, with the interval spanning an 8% reduction to a 14% increase. The primary endpoint was not met. Trial results.
Stage IV diagnoses alone fell 14%, a secondary endpoint with a rate ratio of 0.86 (95% CI 0.744–0.998), reported as nominally significant. This is an encouraging signal, but it does not by itself establish fewer deaths. Trial results.
The original design targeted at least 90% power for the anticipated roughly 20% reduction in late-stage diagnoses, rather than powering the primary analysis for mortality or life-years gained. Longer-term mortality analyses are planned. A mortality benefit has not yet been demonstrated; the trial did not demonstrate that mortality benefit is absent. Trial design; mortality analysis plans.
Should you get the Galleri test?
The case for Galleri is additional cancer detection with relatively few false alarms. The unresolved issue is how much that detection improves health. Our model illustrates the tradeoff by age; it cannot establish an individual’s net benefit.
For someone already completing recommended screening, the decision turns on three practical questions:
- How much additional detection might matter for you? Age and cancer risk affect the potential yield. The model suggests a greater absolute yield at older ages, but health and treatment options also matter.
- Would you pursue the result? The potential benefit depends on completing diagnostic workup and accepting appropriate treatment. The blood draw is only the first step.
- Is that uncertain benefit worth the cost and follow-up burden to you? A low false-positive rate helps, but it does not measure procedure risks, overdiagnosis, or the expense of repeated screening.
A person who values additional detection and accepts those costs and uncertainties may reach a different decision from someone who wants demonstrated mortality benefit before adding a test. Both positions fit the evidence described here. Galleri should supplement recommended screening, including tests that can prevent cancer by finding precancer; a negative result should not delay evaluation of symptoms. NCI guidance.
Appendix
Expand a section for supporting evidence, model assumptions, and detailed results.
Which cancers did Galleri find or miss?
Figure 3b maps the sites and stages of cancers among participants with true-positive and false-negative MCED results. It complements the sensitivity chart with observed findings from PATHFINDER 2. The counts also depend on how common each cancer was in the study, so they are not themselves a ranking of sensitivity.
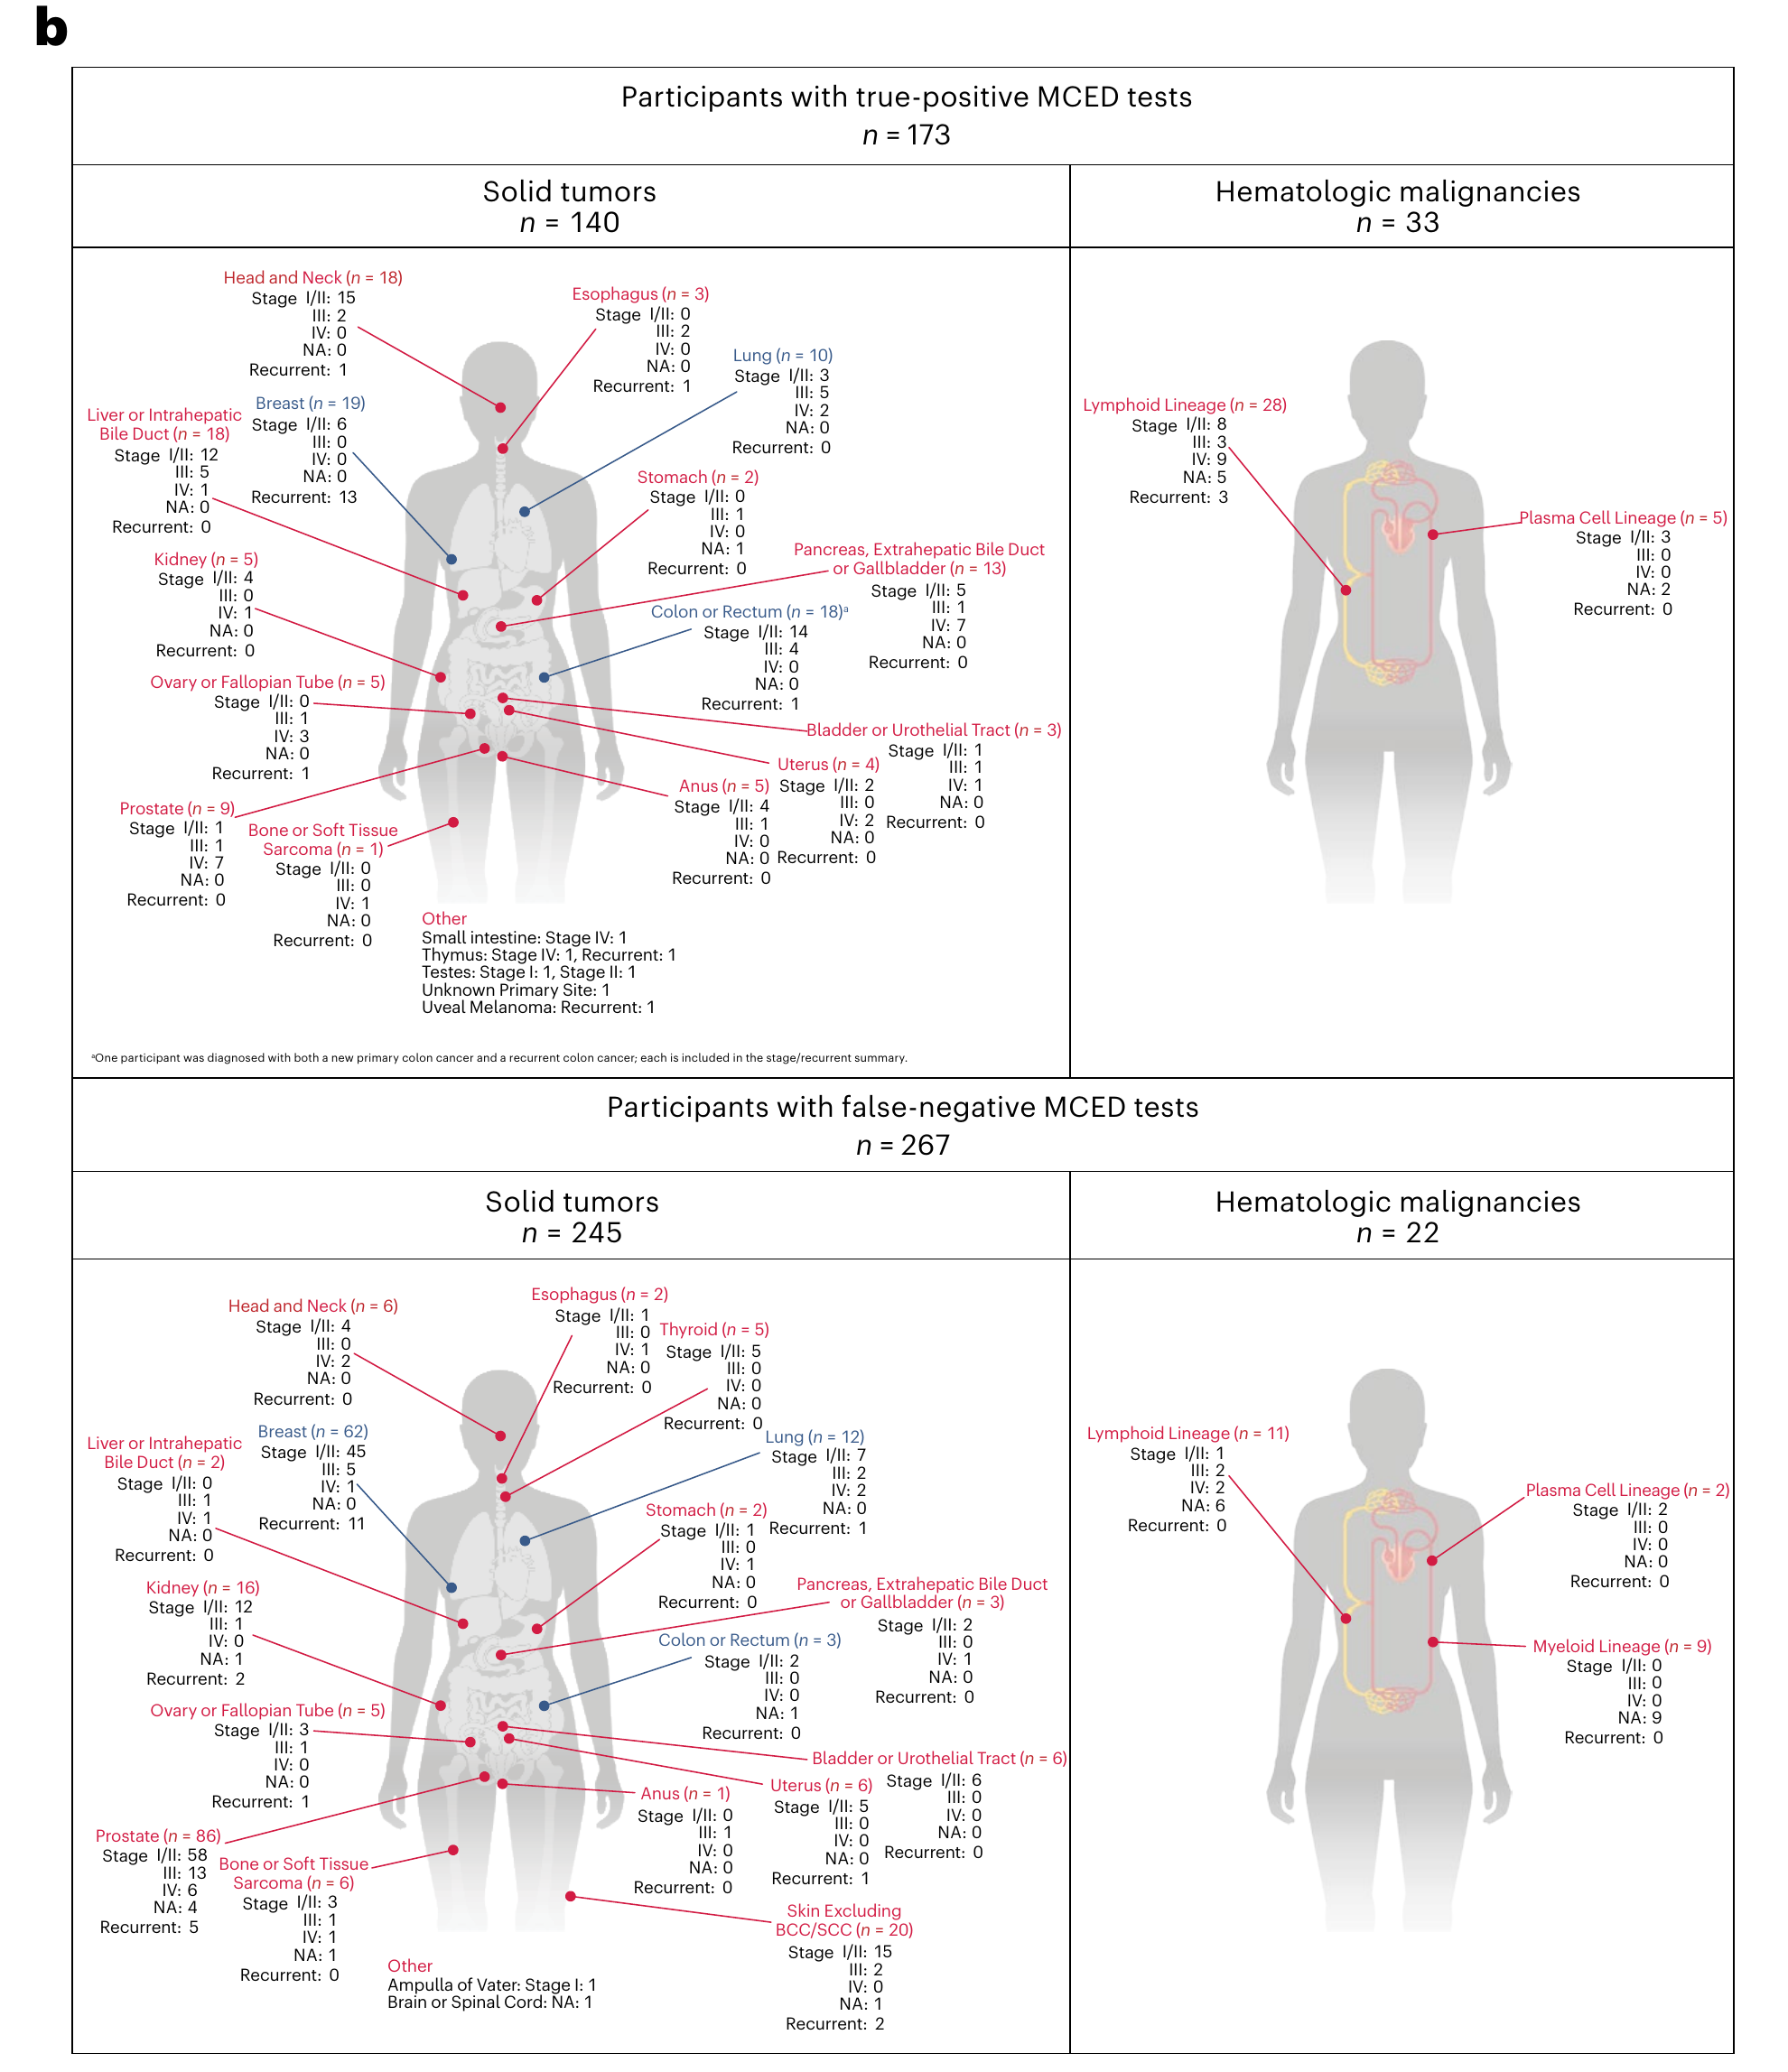
Chart values and methodology
Figure 1: outcomes by screening type
Open full-size PNG · Download annual numbers · Download colonoscopy numbers · MethodsIllustrative annual outcomes per 1,000 eligible people, weighted across each screening’s age range and assuming full adherence. Each row has a different population. Lung eligibility requires at least 20 pack-years and current smoking or quitting within 15 years, with health permitting curative treatment. “Missed” includes cancers arising between screens; false positives count tests. Cervical positivity uses a cancer-only endpoint; colonoscopy’s endpoint instead excludes precancerous polyps.
The separate colonoscopy panel is per 1,000 examinations, not per year. It combines observed cancer yield with modeled misses and benign-polyp interventions. Precancer findings and true negatives appear in the colonoscopy appendix, with assumptions and sources. Study participants were ages 50–84, weighted toward 65+; these figures are not standardized to the recommended 45–75 population.
Eligibility is estimated: cervical anatomy and lung-risk adjustments, including age 80, require assumptions. These are modeled cancer outcomes, not USPSTF estimates of screening benefit.
| Screening | Age | Missed | Caught | False positives |
|---|---|---|---|---|
| Breast | 40–74 | 1.66 | 1.27 | 55.34 |
| Cervical | 21–65 | 0.12 | 0.03 | 14.53 |
| Lung | 50–80 | 1.56 | 5.74 | 52.61 |
Figure 3: policies by age and sex
The bands are 30–49, 50–64, and 65–74. The oldest band is limited to the model's existing ages; it does not represent everyone 65 and older. Outcomes are averaged using sex-specific Census population weights, not simple averages of the five-year rates. Detection percentages are calculated after aggregation.
The 30–49 group extrapolates Galleri performance from older screening populations. It is illustrative, not a validated estimate or screening recommendation. Galleri's stated population is adults at elevated cancer risk, such as ages 50 and older. Within the younger band, this model starts mammography at 40 and colonoscopy at 45, includes cervical cotesting, and excludes lung CT. Suppressed younger cancer-site rates remain in the all-cancer residual, using its assumed Galleri sensitivity.
Open full-size PNG · Download numbers (CSV) · Methods and sources · All scenarios (JSON)Illustrative annual estimates per 1,000 people using a colonoscopy-based guideline baseline, assuming full adherence. “+ Galleri” shows combined-policy totals. Prevented cancers are counted separately, with a hypothetical 20% additional colorectal incidence reduction for both colonoscopy policies. False positives count tests/interventions, not unique people; missed cancers include cancers outside screening scope.
| Sex | Age | Policy | Caught | Missed | Prevented | Detected | False-positive tests |
|---|---|---|---|---|---|---|---|
| Female | 30–49 | USPSTF A/B | 0.39 | 2.33 | 0.02 | 14.3% | 39.3 |
| Female | 30–49 | USPSTF A/B + Galleri | 1.12 | 1.60 | 0.02 | 41.2% | 43.3 |
| Female | 30–49 | Galleri alone | 0.84 | 1.89 | 0.00 | 30.8% | 4.0 |
| Female | 50–64 | USPSTF A/B | 1.66 | 6.38 | 0.12 | 20.7% | 82.4 |
| Female | 50–64 | USPSTF A/B + Galleri | 3.94 | 4.10 | 0.12 | 49.0% | 86.4 |
| Female | 50–64 | Galleri alone | 2.89 | 5.28 | 0.00 | 35.3% | 4.0 |
| Female | 65–74 | USPSTF A/B | 2.98 | 11.41 | 0.20 | 20.7% | 72.0 |
| Female | 65–74 | USPSTF A/B + Galleri | 7.33 | 7.06 | 0.20 | 50.9% | 76.0 |
| Female | 65–74 | Galleri alone | 5.53 | 9.06 | 0.00 | 37.9% | 3.9 |
| Male | 30–49 | USPSTF A/B | 0.01 | 1.36 | 0.02 | 0.6% | 2.1 |
| Male | 30–49 | USPSTF A/B + Galleri | 0.52 | 0.85 | 0.02 | 38.0% | 6.1 |
| Male | 30–49 | Galleri alone | 0.53 | 0.86 | 0.00 | 38.1% | 4.0 |
| Male | 50–64 | USPSTF A/B | 0.41 | 8.01 | 0.18 | 4.9% | 14.7 |
| Male | 50–64 | USPSTF A/B + Galleri | 3.03 | 5.39 | 0.18 | 36.0% | 18.7 |
| Male | 50–64 | Galleri alone | 2.97 | 5.63 | 0.00 | 34.5% | 4.0 |
| Male | 65–74 | USPSTF A/B | 1.27 | 19.56 | 0.29 | 6.1% | 13.8 |
| Male | 65–74 | USPSTF A/B + Galleri | 7.39 | 13.45 | 0.29 | 35.4% | 17.7 |
| Male | 65–74 | Galleri alone | 7.02 | 14.10 | 0.00 | 33.3% | 3.9 |
The five-year results underlying the older-age examples in the article remain available in the original detailed CSV. Broad-band data and younger five-year results.
Colonoscopy: per-exam outcomes and a crude prevention model
One screening colonoscopy
Per 1,000 examinations: a reconstruction of the DeeP-C study, plus explicit assumptions about lesions colonoscopy missed.
| Outcome | Per 1,000 exams | Basis |
|---|---|---|
| Cancer caught | 6.51 | Observed |
| Cancer missed | 0.34 | Inferred from assumed 95% sensitivity |
| Precancer detected | 365.40 | Observed; beneficial findings |
| Precancer missed | 64.48 | Inferred from assumed 85% sensitivity |
| False-positive intervention | 78.86 | Modeled removal of non-precancerous tissue |
| True negative | 484.41 | Modeled: no target lesion or intervention |
The study reported 65 cancers and 3,650 precancer findings among 9,989 participants aged 50–84, with older adults overrepresented. Colonoscopy was the reference test, so its misses were not measured. The USPSTF model assumes 95% cancer sensitivity and 86% specificity among people without adenomas or cancer. We also assume 85% person-level sensitivity for precancer, extrapolating from lesion-level inputs that vary by size. This extra assumption lets us account for missed precancer instead of counting it as a true negative.
These six modeled categories sum to 1,000. They are not an observed confusion matrix. Precancer means the study's advanced precancer and nonadvanced adenoma categories; small serrated lesions remain unresolved. Changing assumed precancer sensitivity from 75% to 95% moves false-positive interventions from 70.8 to 85.2, and true negatives from 435.1 to 523.3, per 1,000 exams. These are scenarios, not confidence intervals.
Per-exam CSV · Inputs and scenarios
A crude annual colonoscopy model
For ages 50–74, the main model uses colonoscopy every ten years. It assumes full adherence and a mature screening program, with an additional 20% reduction in colorectal cancer incidence relative to observed US rates. We test 0%, 20%, and 40%; these are hypothetical additional reductions, not trial estimates of total colonoscopy efficacy.
The observed per-exam cancer yield above is not divided by ten. Instead, the model uses age- and sex-specific incidence, a one-year detectable period, and randomly timed ten-year exams. That gives a 9.5% chance of catching a remaining colorectal cancer before symptoms: a one-in-ten opportunity × 95% sensitivity. This highly simplified timing model is sensitive to the assumed detectable period; downloads also test six months and two years.
At ages 65–69, changing only the prevention assumption gives:
| Sex | CRC reduction | Prevented | Caught: guidelines → + Galleri | Missed: guidelines → + Galleri | FP: guidelines → + Galleri |
|---|---|---|---|---|---|
| Women | 0% | 0.00 | 2.77 → 6.82 | 10.66 → 6.61 | 73.2 → 77.1 |
| Women | 20% | 0.18 | 2.75 → 6.70 | 10.50 → 6.55 | 73.2 → 77.1 |
| Women | 40% | 0.36 | 2.73 → 6.58 | 10.34 → 6.49 | 73.2 → 77.1 |
| Men | 0% | 0.00 | 1.12 → 6.80 | 18.21 → 12.53 | 14.0 → 17.9 |
| Men | 20% | 0.27 | 1.10 → 6.62 | 17.96 → 12.44 | 14.0 → 17.9 |
| Men | 40% | 0.54 | 1.07 → 6.44 | 17.72 → 12.35 | 14.0 → 17.9 |
Both colonoscopy policies receive the same prevention benefit; Galleri alone receives none in this model. For each policy, caught + missed + prevented = the baseline cancer burden. Galleri's detection percentage uses the cancers remaining after prevention. True negatives are omitted from the annual multi-test comparison: the unit is test events, and one person can have several results.
Annual benign-polyp interventions use age/sex-specific GIQuIC adenoma detection as a proxy for precursor prevalence, 86% specificity, and 0.1 routine exams per person-year. This differs from the pooled per-exam study above. Missed adenomas and serrated-only precancers are not fully corrected; surveillance procedures are excluded. These assumptions can overstate the target-negative population and understate total procedure burden.
This is a rough mature-program scenario, not a longitudinal simulation. It does not model the years before prevention takes effect, aging, adenoma progression, repeat-round yields, surveillance, mortality, or overdiagnosis. Galleri overlap retains the main model's independence assumption. It cannot establish superiority, mortality benefit, or life-years gained.
The assay under FDA review
The FDA’s briefing for its September 23, 2026 advisory meeting evaluates a revised Galleri assay, with changes to its laboratory workflow, classifier, and analysis pipeline. Researchers tested stored samples from PATHFINDER 2 and NHS-Galleri and weighted the results to represent the eligible study populations. For that assay, 12-month episode sensitivity was 35.0% and 31.6%, respectively, with false-positive rates of 0.15% and 0.26% and positive predictive values of 77.0% and 66.2%. These are different assay and analysis populations, not simply updates to the earlier trial percentages. FDA briefing, pp. 8–9, 45.
The main chart retains the earlier assay assumptions; separate sensitivity analyses below explore the FDA-reviewed assay. Safety follow-up in the briefing comes from MCED-V2, whose results were actually returned to participants; FDA treats it as an approximate estimate for the revised assay. FDA briefing, p. 15.
What happens after a false positive?
The full-study follow-up results are described in the main text. The FDA briefing uses a smaller analysis population, so its counts differ from the Nature Medicine paper. In the FDA’s PATHFINDER 2 safety analysis, 43 of 90 participants without a cancer diagnosis underwent an invasive procedure (47.8%), including four who underwent surgery (4.4%). Median time to diagnostic resolution was 75 days for false positives, versus 36 days for true positives. These observations concern MCED-V2; no study-related adverse events in the diagnostic-workup analysis were serious. FDA briefing, pp. 16, 24.
The study also measured anxiety: positive results produced a temporary increase that trended toward pre-test levels by 12 months. This gives a more concrete picture than treating every false-positive test as an equivalent harm. FDA briefing, pp. 24–25.
FDA-reviewed assay: earlier FIT-based sensitivity analyses
These retained analyses use the earlier FIT-based baseline, not the colonoscopy baseline in the main chart. FIT model and FDA scenarios.
The FDA briefing supplies cancer-type results from screening cohorts, allowing us to test alternatives to uniformly scaling the older CCGA estimates. We run separate PATHFINDER 2 and NHS-Galleri scenarios using new-primary cancer counts from its appendix and each study’s overall false-positive rate. For categories with fewer than five cases or no suitable match, we assume that study’s overall new-primary sensitivity. This fallback and the transfer to US age/sex groups remain modeling assumptions. FDA briefing, pp. 48–51.
With each study’s overall false-positive rate, these alternative profiles produce 1.3–6.3 additional detections per 1,000 people annually, compared with 1.3–6.4 in the earlier FIT central scenario. Added false-positive tests are approximately 1.5 per 1,000 for the PATHFINDER-based scenario and 2.6 for the NHS-based scenario. These are modeled results, not observed incremental trial yields.
We also vary false-positive rates by age within each FDA scenario. The reported rates and 95% confidence intervals, calculated as one minus specificity, are:
| Age | PATHFINDER 2 false-positive rate | NHS-Galleri false-positive rate |
|---|---|---|
| 50–59 | 0.05% (0.02–0.17%) | 0.09% (0.05–0.17%) |
| 60–69 | 0.05% (0.02–0.13%) | 0.22% (0.10–0.48%) |
| 70–79 | 0.31% (0.13–0.75%) | 0.45% (0.28–0.73%) |
The studies were not powered for subgroup comparisons. We apply each decade’s estimate to its constituent five-year groups and both sexes, then rerun at the interval endpoints; these are sensitivity analyses, not confidence intervals for our model. They allow false positives to rise with age rather than assuming that rate stays fixed. FDA briefing, pp. 25, 38, 52, 54.
The studies also differ in cancer definitions: the NHS registry did not capture recurrent cancers, so test-positive recurrences counted as non-cancer in that analysis. Keeping the two studies separate preserves this uncertainty. FDA briefing, p. 27.
Earlier FIT baseline: outcomes by screening type
Here is the earlier FIT-based USPSTF baseline broken down by test for 1,000 women or men aged 65–69 per year, using annual FIT and eligible lung CT, biennial mammography, and five-year cervical cotesting. These are modeled program outcomes, not results per 1,000 tests.
| Sex | Screening | Caught | Missed | False positives |
|---|---|---|---|---|
| Women | Colorectal: FIT | 0.67 | 0.23 | 59.95 |
| Women | Breast: mammography | 1.83 | 2.38 | 55.27 |
| Women | Cervical: Pap + HPV | 0.00 | 0.10 | 2.10 |
| Women | Lung: low-dose CT | 0.84 | 0.95 | 6.84 |
| Men | Colorectal: FIT | 1.00 | 0.35 | 59.92 |
| Men | Lung: low-dose CT | 1.00 | 1.12 | 6.83 |
Download all ages, 50–74 (CSV) · Methods and sources
“Missed” counts cancers of that test’s target type that screening does not catch, including cancers in people outside eligibility and those arising between scheduled tests; it is broader than false-negative results among people actually tested. Caught cancers and false-positive tests sum to the earlier FIT model’s guideline totals, but missed cancers here exclude other cancer types.
The cervical row is small because only age 65 remains eligible in the 65–69 band, and the model also adjusts for the fraction with a cervix. Lung screening applies only to people meeting the smoking criteria. False-positive counts use cancer as the endpoint: some positive FIT or cervical results identify useful precancer, so these counts do not measure unnecessary procedures or harm.
Get your free 30-day heart health guide
Evidence-based steps to optimize your heart health.