Wearable foundation models: a brief history
Modern wearables are both consumer technologies and medical devices. Apple Watch, Fitbit, and Samsung watches are FDA-cleared to take ECGs, detect sleep apnea, and screen for hypertension. Beyond FDA-cleared features, they generate data streams for heart rate, heart rate variability, blood oxygen saturation, skin temperature, sleep, and VO2Max.
Many medical capabilities stem from wearable foundation models. WFMs are neural networks pretrained on enormous amounts of unlabeled sensor data, then adapted to specific tasks (detecting hypertension, predicting a biomarker, estimating VO2Max) with small amounts of labeled data. It’s roughly the same recipe that produced GPT for text and CLIP for images, except applied to physiology.
I worked on one of the forerunners to wearable foundation models in 2018. Our model was a sequence encoder with multiple pretraining objectives, which was fine-tuned to detect atrial fibrillation, sleep apnea, hypertension, and diabetes from consumer heart rate sensors. In 2023 and 2024, Apple and Google published their first wearable foundation models; by 2025 there were at least four more, each fixing a limitation of the last.
This post walks through wearable foundation models from 2018 to 2026, including Apple’s two models (one trained on raw PPG and ECG waveforms, one on behavioral data), Google’s three (LSM, LSM-2, and SensorLM), and JETS, the model we trained at Empirical Health. We’ll focus on the main design decisions around architecture, pretraining objective, and input data that differ between each WFM.
 The lineage of wearable foundation models, from Cardiogram’s 2018 DeepHeart and early self-supervised work at Cambridge (2020) to the 2023-2025 wave from Apple, Google, and Empirical Health.
What is a wearable foundation model?
Like any foundation model, a wearable foundation model is trained in two stages:
- Pre-training, where the model learns the structure of the data without any labels. For wearables, that usually means self-supervised learning: hide part of a sensor stream and ask the model to fill it in, or show it two segments from the same person and teach it they belong together. Either way, the model learns a compressed representation (an “embedding”) of what a healthy heart, a restless night, or a hard workout looks like.
- Post-training. Because the model’s latent space already captures so much physiology, you can train a simple classifier on top of it (often just a single linear layer, i.e., linear probing) using only a few hundred labeled examples.
Each of these stages have a set of design choices. For pretraining.
Apple’s PPG and ECG foundation model
In a paper first posted in late 2023 and presented at ICLR 2024, Apple trained two models on raw biosignals from the Apple Heart and Movement Study: one on photoplethysmography (the optical signal that Apple Watch uses to measure heart rate) and one on the Watch’s electrocardiogram (ECG).
Basic rundown (I’ll explain these of these more next):
- Input: Raw PPG and ECG waveforms.
- Training data scale: 19.85M 60-second PPG segments (141,207 people) and 3.75M 30-second ECG recordings (106,643 people).
- Architecture: EfficientNet-style 1D convolutional network (2.5-3.3M parameters), producing a 256-dimensional embedding.
- Loss: Contrastive, with participant-level positive pairs, a momentum encoder, and a KoLeo entropy regularizer.
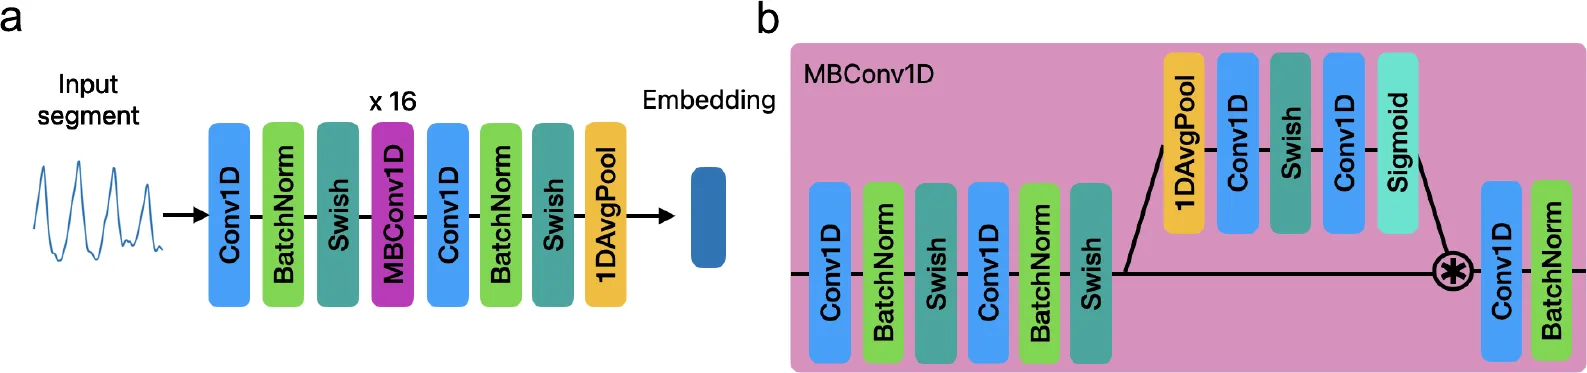 The encoder (a) stacks Conv1D, batch-norm, and Swish layers with 16 repeated MBConv1D blocks, then average-pools to a single embedding. Panel (b) is the internal MBConv1D block. Source: Large-scale Training of Foundation Models for Wearable Biosignals, ICLR 2024.
The most clever part is the training objective. Instead of reconstructing the raw signal, Apple shows the model two different segments from the same person and teaches it to map them close together in embedding space, while pushing apart segments from different people. The intuition is that whatever is stable across a person’s segments (their cardiovascular physiology) is the physiological signal tha the latent space should capture (JEPA-style architectures capture the same intuition slightly differently).
The results were actually genuinely impressive. Across dozens of conditions and medications, the PPG embeddings beat a baseline built from age, BMI, sex, and heart rate. (PPG also consistently outperformed ECG, which Apple attributes to PPG being collected passively in the background many times a day, while ECG requires the user to sit still and take a reading.)
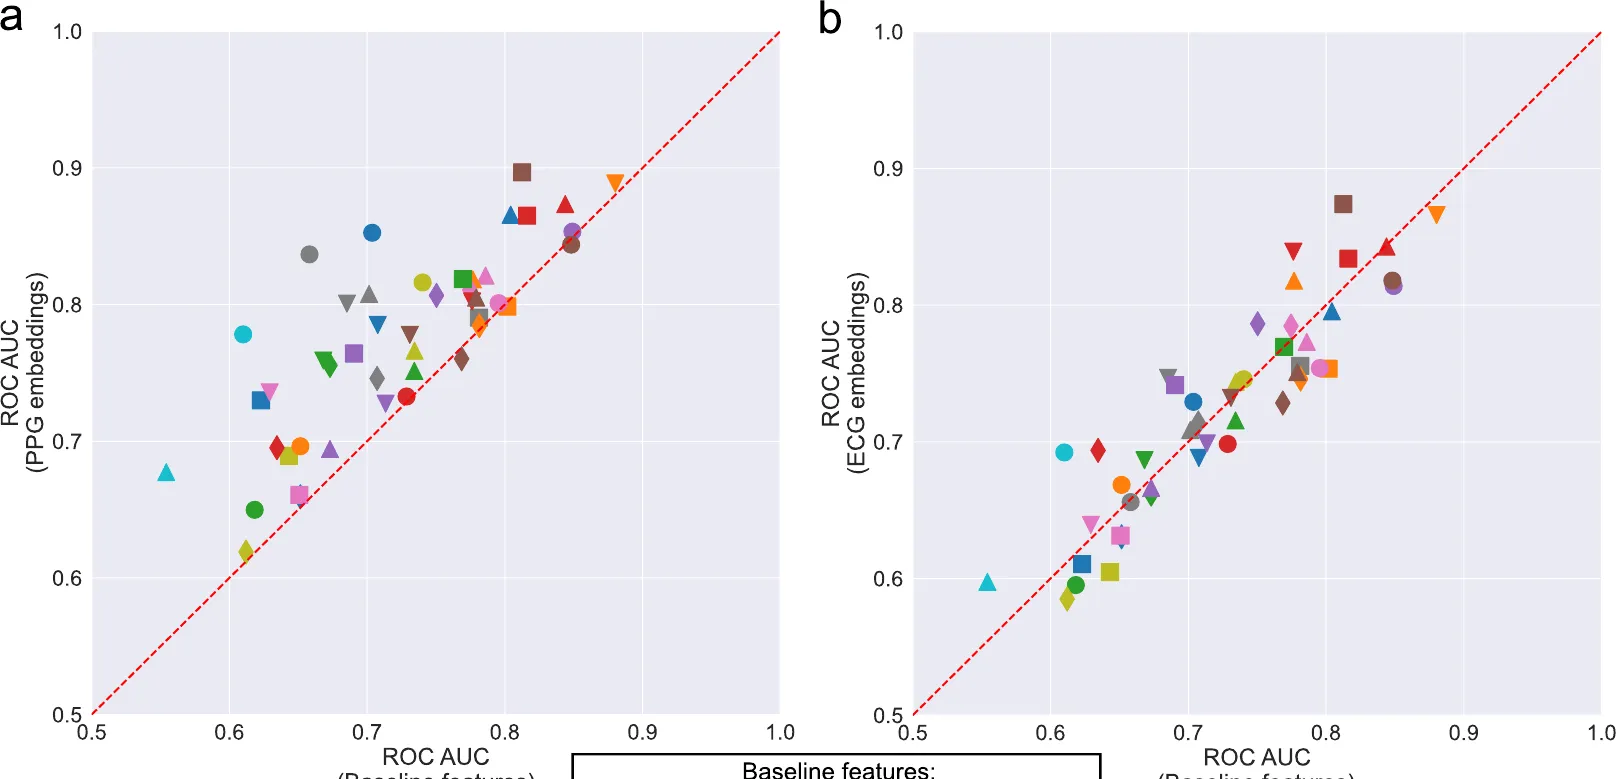 Each marker is a health condition. The y-axis is the AUC using the foundation model’s embeddings; the x-axis is the AUCROC for a baseline model of age, sex, BMI, ethnicity, and heart rate. Most PPG markers (left) sit above the diagonal, meaning the embeddings carry health signal beyond just basic demographics. Same ICRL 2024 paper as as above.
Apple’s behavioral foundation model
Is it better to train on the raw waveform, or on higher level timeseries over a longer time period? Or both? Apple answered with a Wearable Behavior Model (WBM) in a 2025 ICML paper.
WBM makes a bunch of very different choices than the previous model:
- Input: 27 interpretable HealthKit metrics (resting heart rate, HRV, step count, walking speed, VO2 max, wrist temperature, and more), as a weekly 168-by-27 grid plus a missingness mask.
- Training data scale: 15.14M person-weeks (~2.5 billion hours) from 161,855 people in the Apple Heart and Movement Study.
- Architecture: Bidirectional Mamba-2 state-space model (24 layers, 256 hidden dimensions), which beat Transformer variants in a bake-off.
- Loss: Contrastive (the one part that’s similar to above).
Across 57 health tasks, WBM beats a simple statistical baseline on the large majority. It dominates on anything behavior-driven (e.g., it explains 59% of the variance in sleep duration, where the raw-PPG model explains almost none). However, the two models are better together. On pregnancy detection, combining WBM with the PPG model pushes AUROC above 0.9, well beyond either alone (presumably because pregnancy changes both physiology and behavior).
Google’s LSM-1 and LSM-2
Google trained their own wearable foundation model, Large Sensor Model (LSM), which comes in two generations, LSM-1 and LSM-2.
The original LSM paper is best understood as a scaling-laws paper, and the point was to show that LLM-style scaling laws hold for sensor data. Loss falls as a power law in compute, data, and model size, then saturates around 10 million hours and 100 million parameters.
The scaling law for wearables is:
where is compute, is the power-law exponent, and is an irreducible floor.
LSM itself is larger than the models discussed above:
- Data: Up to 40M hours from 165,090 people (Fitbit Sense 2 and Pixel Watch 2).
- Input: 26 minutely features from four sensors (PPG, accelerometer, EDA, altimeter), as a 26-by-300 “sensor image” over a five-hour window.
- Architecture: Vision Transformer (up to ~328M parameters).
- Loss: Masked-autoencoder reconstruction; 80% random masking beat four other masking schemes.
The downstream tasks were less clinical than Apple’s foundation model, e.g., LSM improved imputation, interpolation, and forecasting by 16% to 47% over baselines, and lifted activity recognition by 29%.
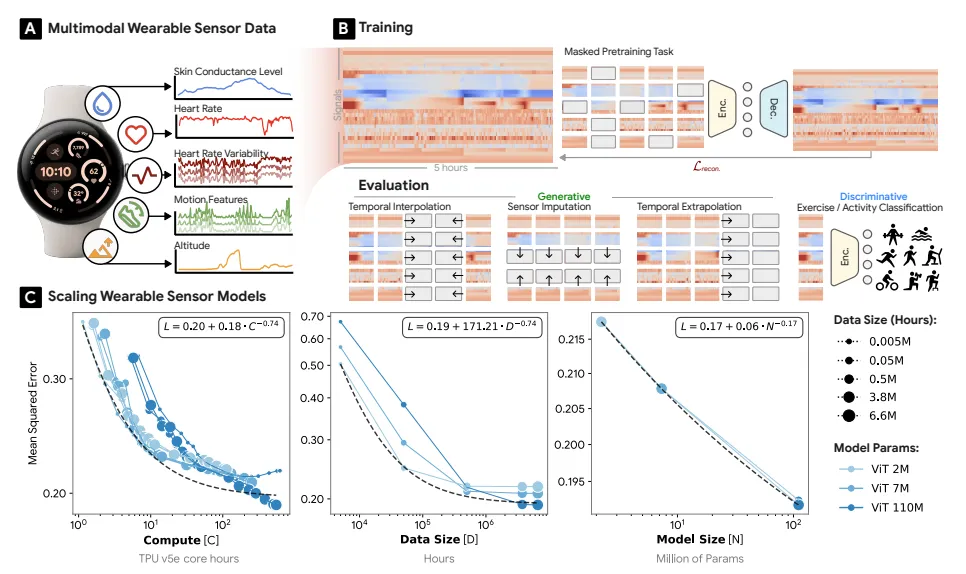 LSM architecture, pretraining, and scaling curves. Source: Scaling wearable foundation models, 2024.
LSM-2 (2025) refined LSM to deal with some of the constrants of real-world data. For example, real wearable data is fragmented: people charge the watch, sensors drop out, and a typical day is about 49% missing. LSM-1 and Apple’s models impute those gaps before training, which bakes in artifacts. LSM-2 instead learns directly from incomplete data. The training data and input are essentially the same as LSM, but with a smaller neural net (ViT-1D with 25M params) and a new loss funciton. The they call the loss AIM (Adaptive and Inherited Masking), and it makes the encoder’s mask the union of two masks: an “inherited” mask for data that’s genuinely missing, and an “artificial” mask of dropped tokens that give the model something to reconstruct.
JETS: a JEPA for irregular health timeseries
Every model above is built by a company with thousands of employees. JETS (Joint Embedding for Timeseries) is ours, built by a four-person team at Empirical Health, and it shows a small lab can work at the same scale.
Basic rundown:
- Training data: 3M de-identified patient-days (Apple Watch, Samsung Galaxy, Fitbit).
- Input: A 63-channel irregularly-sampled multivariate timeseries (oxygen saturation, resting heart rate, sleep stages, HRV, and more), encoded as (timestamp, value, metric type) triplets rather than forced onto a regular grid.
- Architecture: JEPA (Joint Embedding Predictive Architecture): twin EMA-tied encoders plus a predictor, with Mamba or Transformer blocks.
- Loss: Prediction in latent space (predict the target encoder’s embedding), not raw-signal reconstruction.
The JEPA approach is advocated by Yann LeCun as a path to AGI beyond next-token prediction. There are two twin encoders: one sees the full token sequence, the other sees a random 30%, and a predictor maps the masked view to the full view’s latent vector. Because JEPA models reconstructs in latent space rather than raw signal space, the encoder can ignore sensor noise and focus on meaningful physiology.
Like Apple’s foundation model, we evaluated JETS on medical tasks. For example, it detected hypertension at 87% AUROC, sick sinus syndrome at 87%, ME/CFS at 81%, and atrial flutter at 70% (this beat both masked-autoencoder and PrimeNet baselines). It also predicted absolute biomarker levels (HbA1c, glucose, HDL, hs-CRP) more accurately than baselines, though absolute error remains high. We presented this work at the NeurIPS 2025 TS4H workshop.
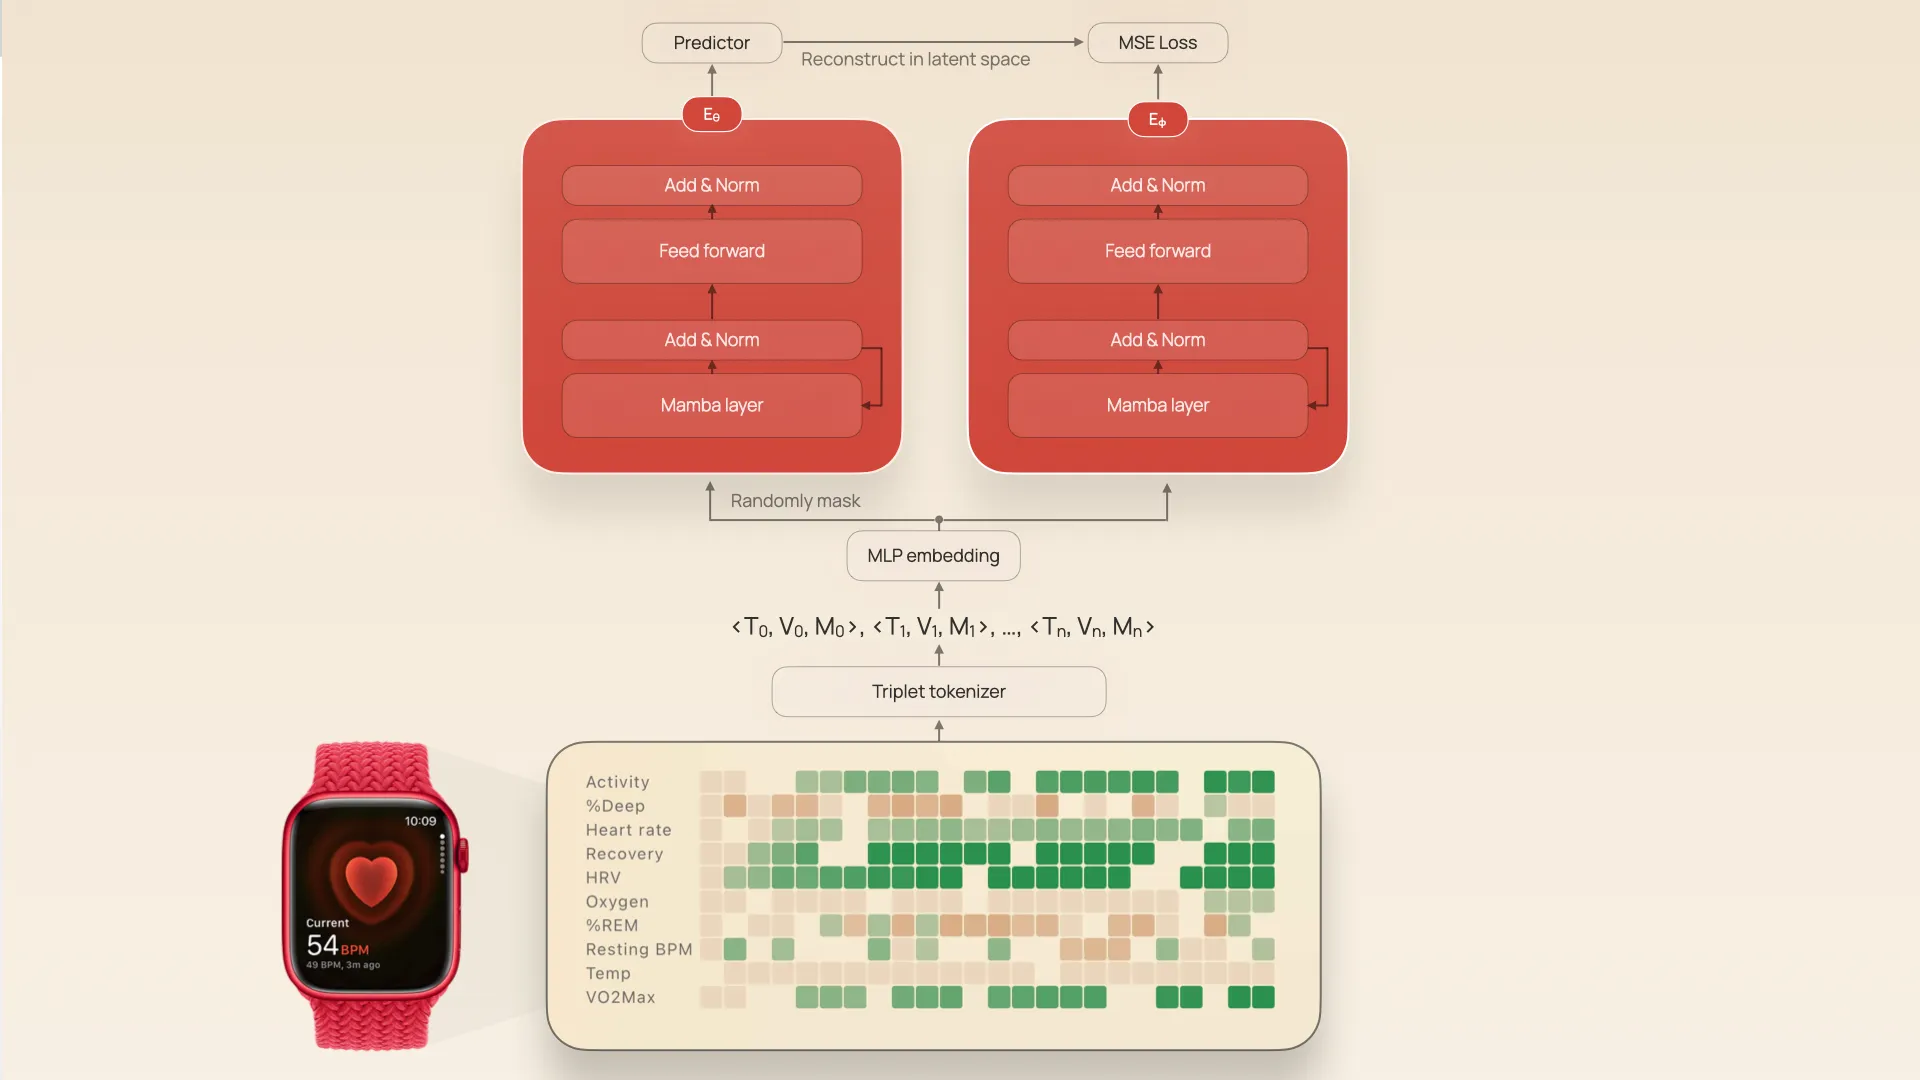 The JETS architecture. Triplet tokenization of irregular wearable data feeds twin JEPA encoders.
SensorLM: a sensor-language model
Google has one last model, SensorLM, which is patterned after CLIP. (CLIP “translates” between language and images by aligning the latent space of an image model to the latent space of an LLM. If you’ve generated an image in ChatGPT, you’ve used something like CLIP)
SensorLM aligns sensor data with natural-language text so the model can describe a day of physiology in words and answer questions about it zero-shot.
- Data: 59.7M hours (~2.49M person-days) from 103,643 people across 127 countries, the largest sensor-language dataset to date.
- Input: 26 minutely sensor features paired with auto-generated text captions.
- Architecture: A Vision Transformer sensor encoder, a text encoder, and a multimodal decoder (3M to 1.27B parameters).
- Loss: Combined contrastive and generative captioning (the “CoCa” framework).
The hard part of CLIP for wearables is that nobody writes captions for sensor data. Google solved this with an automated, hierarchical caption pipeline that turns each day of sensor data into text at three levels: statistical (means and ranges per channel), structural (trends, spikes, and drops with time stamps), and semantic (recognized activities and sleep, like “Outdoor Bike from minute 550 to 561”).
Because SnesorLM learns the joint sensor-text space, you can actually ask it questions about your wearable data. I htink it’s a very coola rchitecture, although my criticism here is that it hasn’t been proven.
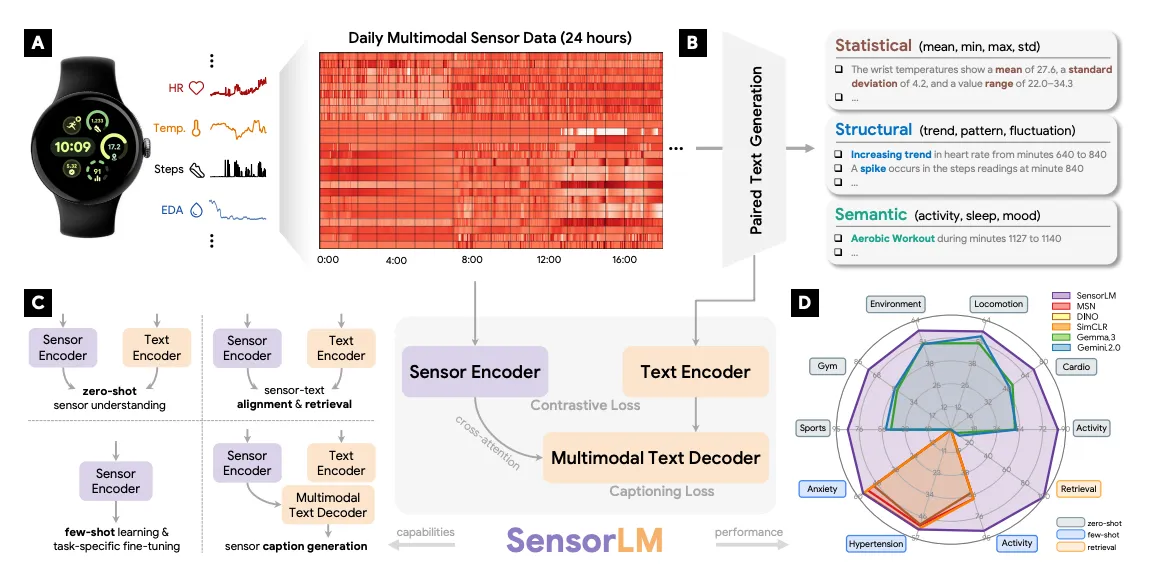 SensorLM architecture. A day of sensor data (left) is automatically described at three levels: statistical (means and ranges), structural (trends, spikes, and drops with time stamps), and semantic (recognized activities like cycling and sleep). Source: SensorLM paper, NeurIPS 2025.
How the wearable foundation models compare
Wearable foundation models vary the most based on their input data (narrow raw waveforms to broad behavioral timeseries), neural net architecture (convolutional networks to Vision Transformers to state-space models to joint-embedding predictors). Here’s a comparison table that lines up all of these core decisions:
| Model | Year | Lab | Dataset size | Input data | Architecture |
|---|---|---|---|---|---|
| Apple PPG/ECG | 2023 | Apple | 19.85M PPG segments (141K people); 3.75M ECG segments (107K people) | Raw 60s PPG and 30s ECG waveforms | EfficientNet-style 1D CNN (2.5-3.3M params); contrastive, participant-level pairs |
| LSM (LSM-1) | 2024 | Up to 40M hours; 165K people | 26 minutely features from 4 sensors, 5-hour windows | ViT masked autoencoder (up to 328M params); 80% random masking | |
| Apple behavioral (WBM) | 2025 | Apple | 15.14M person-weeks (~2.5B hours); 162K people | 27 hourly HealthKit metrics, weekly windows | Bidirectional Mamba-2 (24 layers); contrastive |
| LSM-2 | 2025 | 3.58M person-days (~40M hours); 60K people | 26 minutely features from 5 sensors, 24-hour windows | ViT-1D (25M params); Adaptive & Inherited Masking | |
| JETS | 2025 | Empirical Health | 3M person-days | 63-channel irregular multivariate timeseries (triplets) | JEPA twin EMA encoders + predictor (Mamba/Transformer); latent-space prediction |
| SensorLM | 2025 | 59.7M hours (~2.49M person-days); 104K people | 26 minutely sensor features plus generated text captions | ViT sensor encoder + text encoder + decoder (3M-1.27B params); contrastive plus captioning (CoCa) |
There are a few patterns I think stand out. One is that dataset scale converged fast: a three-person startup trained on the same order of magnitude of data (3 million person-days) as Google. Raw waveforms and behavioral metrics turn out to be complementary, not competing, which is why Apple’s own paper recommends combining them. And the hardest engineering problems end up being the unglamorous ones — missing data (LSM-2) and irregular sampling (JETS).
These are still early days. None of these models is deployed as a medical device, and all of them report results on different datasets, so the accuracy numbers aren’t directly comparable. But they show that the wrist is becoming one of the richest sources of physiological ground truth, and the models that learn from it are getting better every few months — the early part of an exponential curve we saw with LLMs.
Get your free 30-day heart health guide
Evidence-based steps to optimize your heart health.