Diet can lower your cholesterol in a counterintuitive way. The most important nutrients for lowering LDL aren’t dietary cholesterol, but fiber (get more) and saturated fat (get less).
We’ll compare how much diets and individual foods lower LDL, then plot meals on a fiber–saturated-fat grid to find useful swaps.
How much can diet lower LDL cholesterol?
In a six-month trial of 345 adults, the Portfolio diet (nuts, soy protein, viscous fiber, and plant sterols) lowered LDL by 13.1–13.8% from baseline, compared with 3.0% for a low-saturated-fat comparison diet. A 13% reduction from LDL 160 mg/dL is about 21 mg/dL, though individual results vary. If you need a larger reduction to reach your goal, diet can work alongside LDL-lowering medications.
What foods lower LDL cholesterol?
A 2021 review of 108 systematic reviews compared foods by LDL effect and evidence strength, covering research through June 2019. The strongest evidence supports replacing saturated fats with unsaturated oils, eating soluble-fiber foods, and using foods with added plant sterols or stanols.
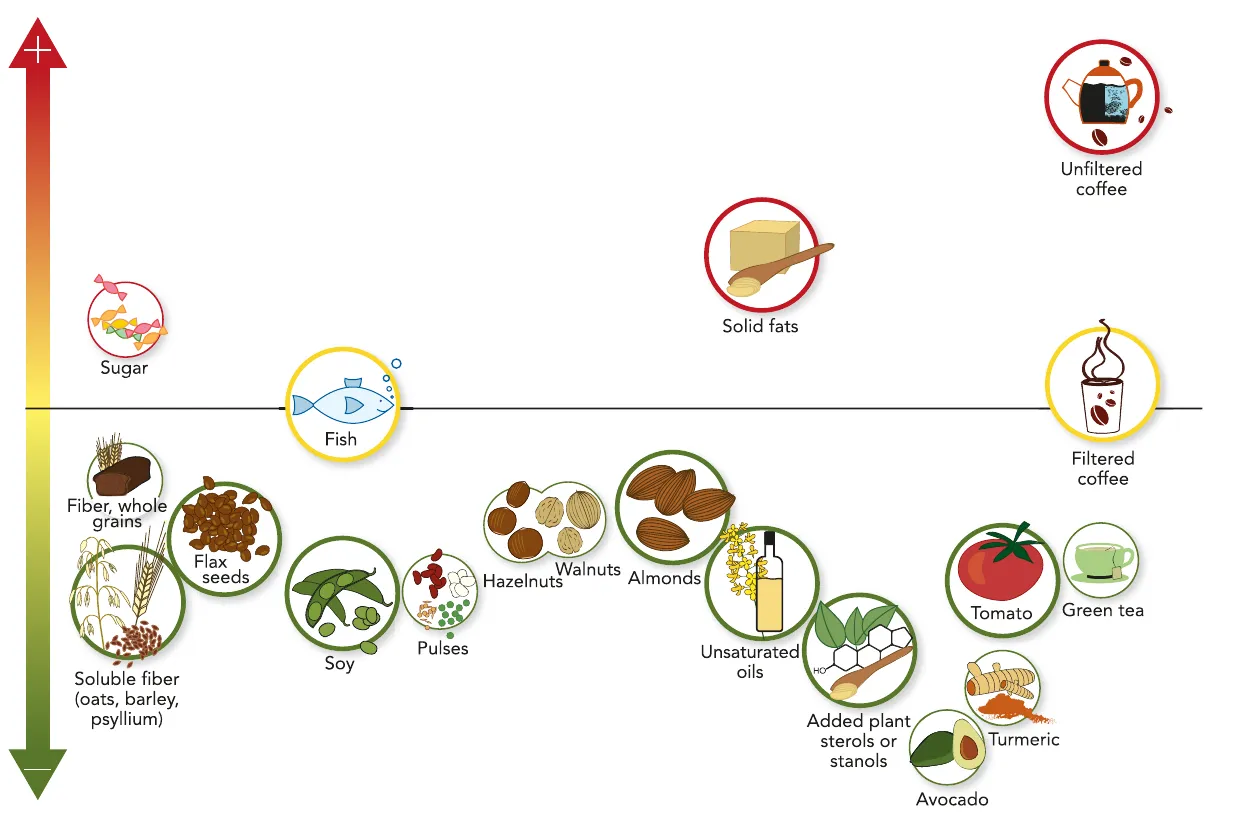
Figure 3 from Schoeneck and Iggman, 2021, reproduced under CC BY 4.0; cropped from the original page. Foods below the line lower LDL; foods above it raise LDL. Larger circles indicate high-certainty evidence; smaller circles indicate moderate certainty. Positions illustrate relative effects, not precise estimates.
In the table below, small means under about 8 mg/dL, moderate means about 8–15 mg/dL, and large means over about 15 mg/dL. Doses and comparison foods differ across studies.
| Food or change | Reported LDL reduction | Evidence certainty | A way to use it |
|---|---|---|---|
| Unsaturated oils replacing saturated fats | Moderate to large | High | Replace butter with canola or olive oil |
| Oats, barley, psyllium | Moderate | High | Choose oats or barley for soluble fiber |
| Foods with added plant sterols or stanols | Moderate | High | Look for fortified foods; ordinary plant foods aren’t equivalent doses |
| Whole flaxseed, soy protein, tomatoes | Small to moderate | High | Add ground flaxseed to oats, or use tofu and tomatoes in a meal |
| Almonds | Small | High | Use as a snack or topping |
| Avocado | Moderate to large | Moderate | Use in a sandwich or on toast |
| Beans, lentils, hazelnuts | Small to moderate | Moderate | Replace some meat with beans or lentils |
| Walnuts, whole grains | Small | Moderate | Add walnuts to breakfast or choose whole-grain bread |
You can’t add these reductions together. Portions and replacement foods differ; the Portfolio trial above tested a combination directly.
What else affects cholesterol?
Fiber and saturated fat don’t capture every dietary effect. Unfiltered coffee can raise LDL, while filtered coffee had no effect in this review; see which brewing methods affect cholesterol.
Food structure matters, too. In a trial of 92 people, LDL was 3.3% lower with a cheese-rich diet than a butter-rich diet containing the same saturated fat. It was still higher than with diets rich in unsaturated fat. Fish had no clear LDL effect in the review, which doesn’t mean it has no other health benefits.
How can you plot your meals on a fiber–saturated-fat matrix?
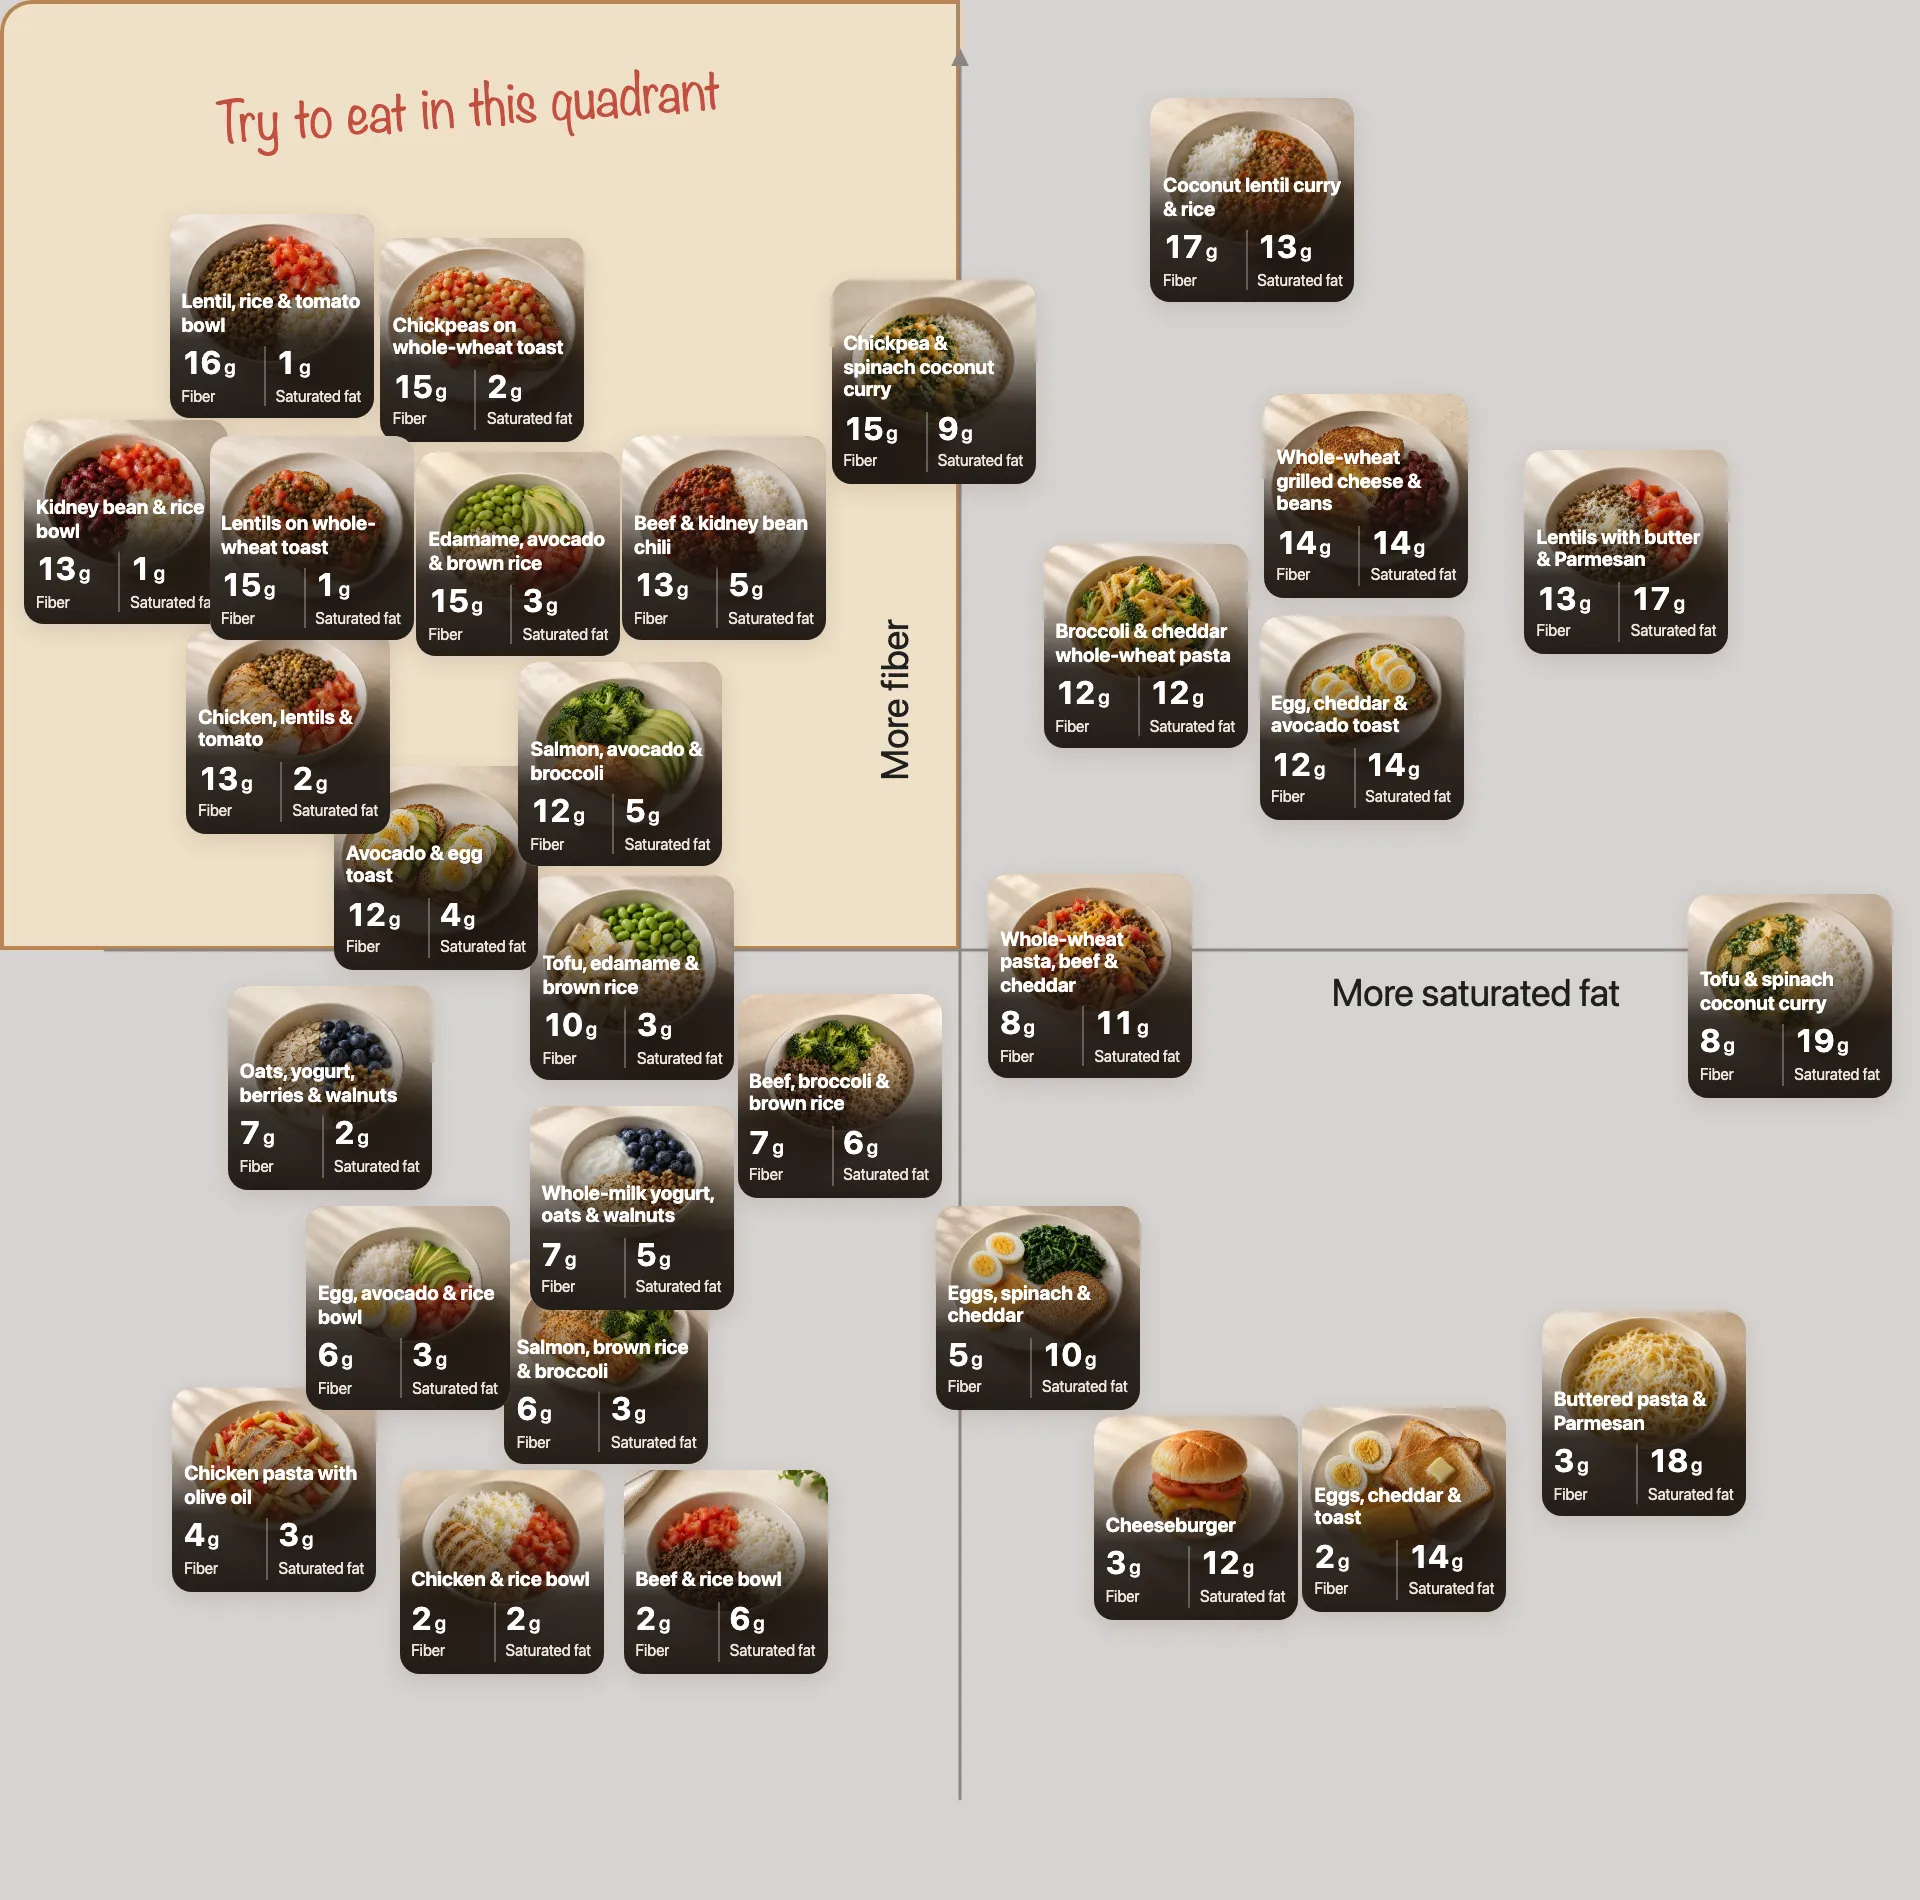
To plot your meals in Empirical Health, open the fiber-to-saturated-fat view and choose “Cholesterol impact.” Fiber increases upward; saturated fat increases to the right. Aim for the highlighted upper-left quadrant: more fiber, less saturated fat. These 30 example meals use USDA food data:
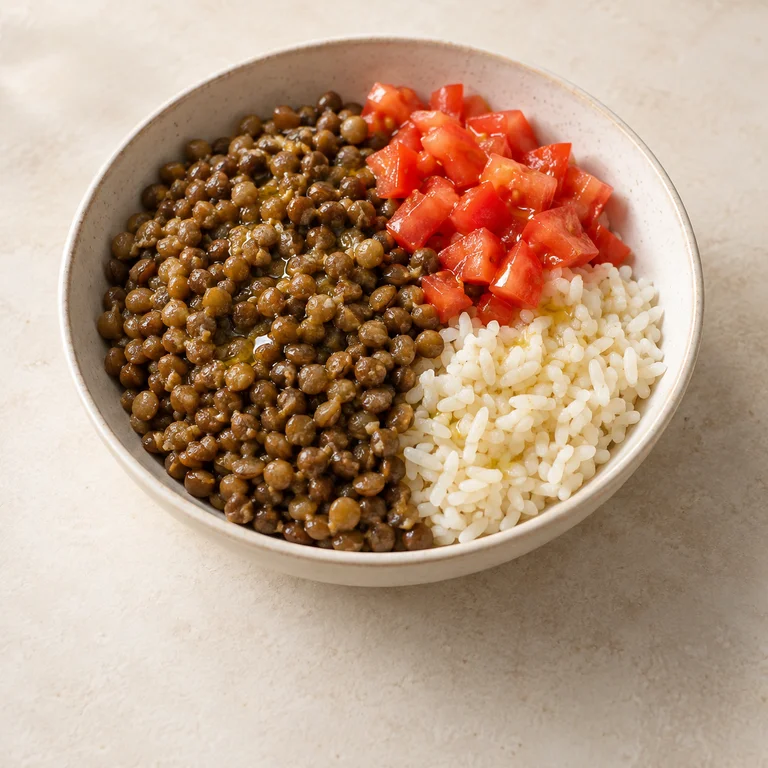
Lentil, rice & tomato bowl
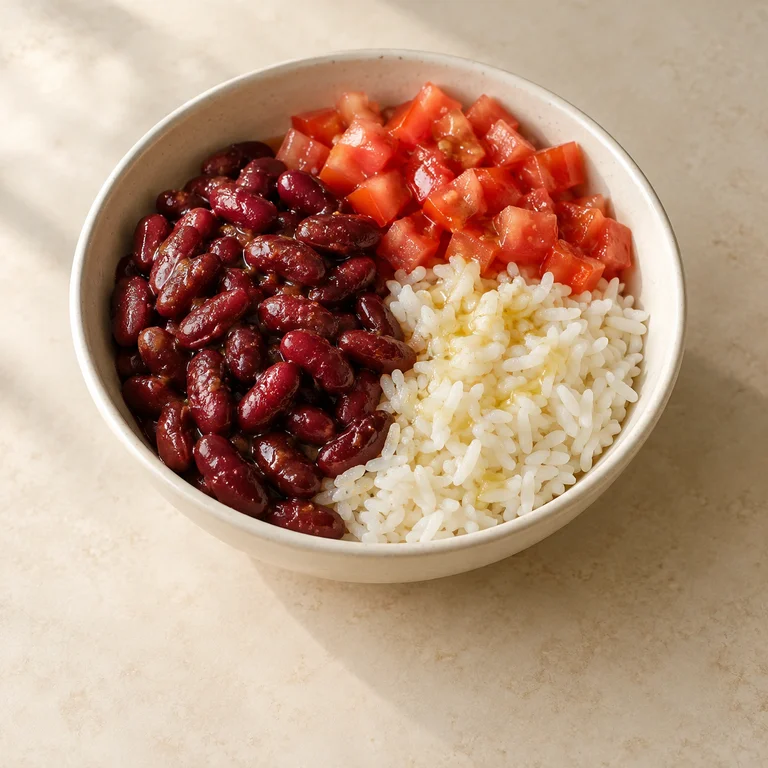
Kidney bean & rice bowl
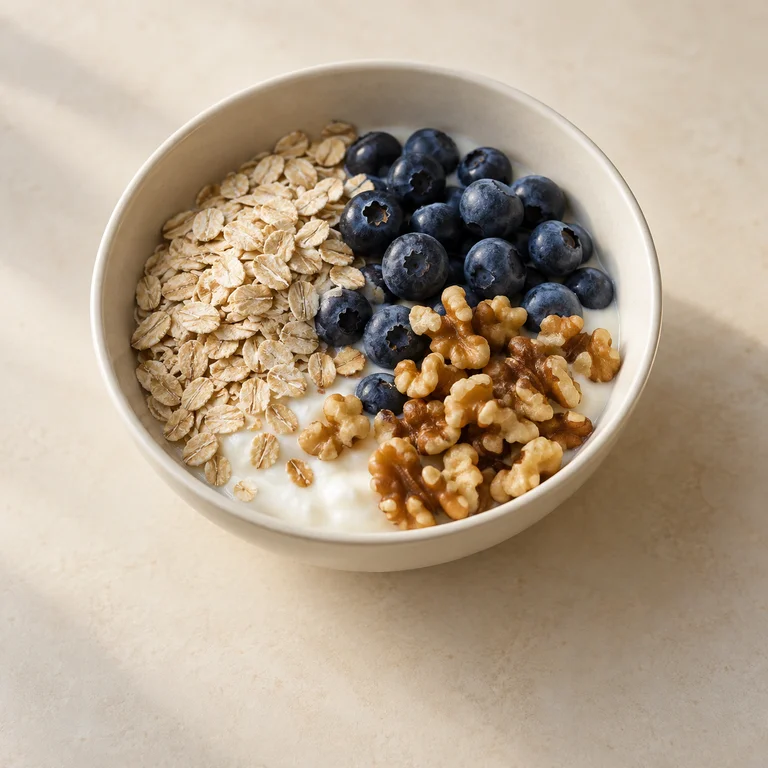
Oats, yogurt, berries & walnuts
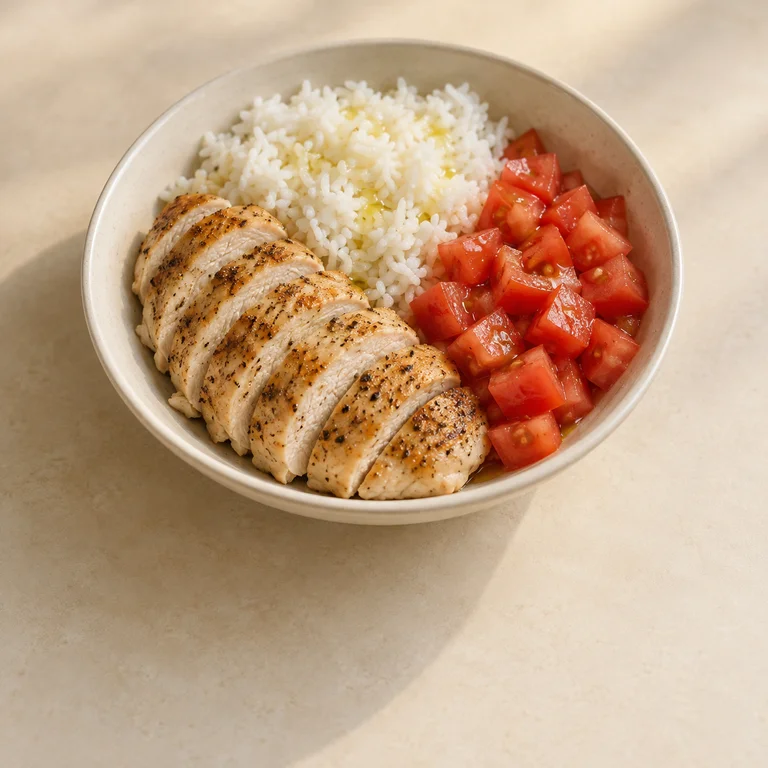
Chicken & rice bowl
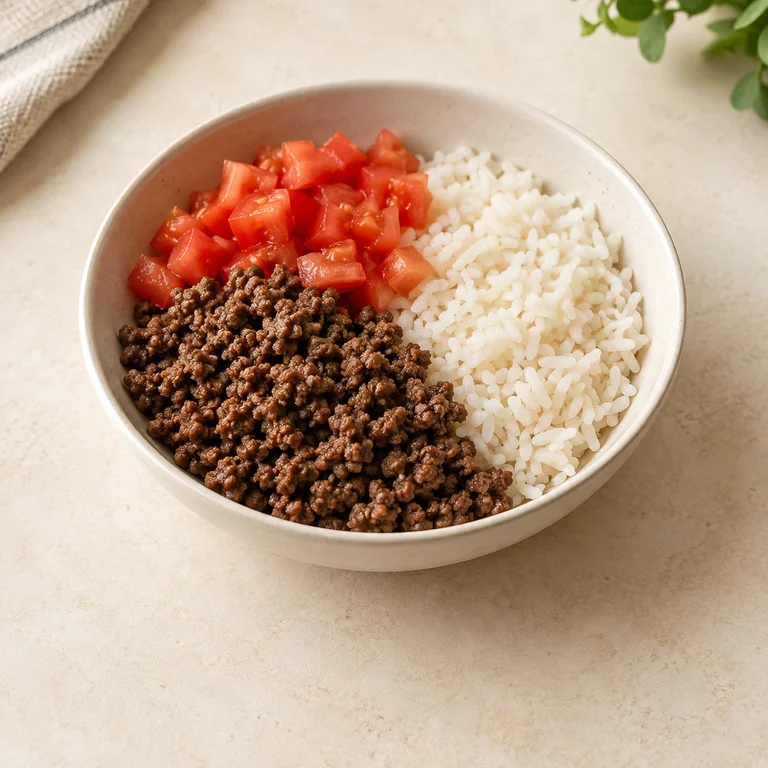
Beef & rice bowl
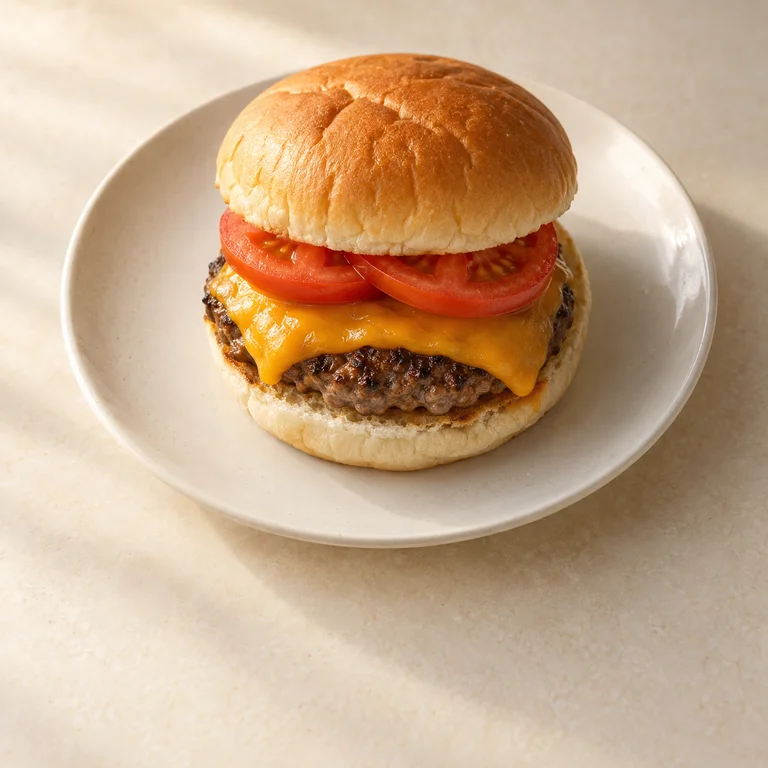
Cheeseburger
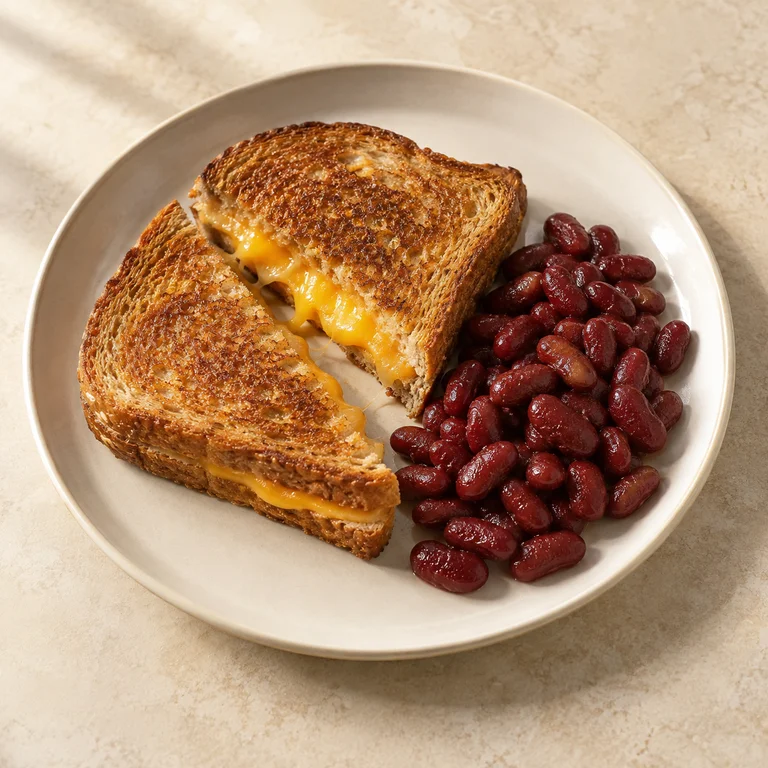
Whole-wheat grilled cheese & beans
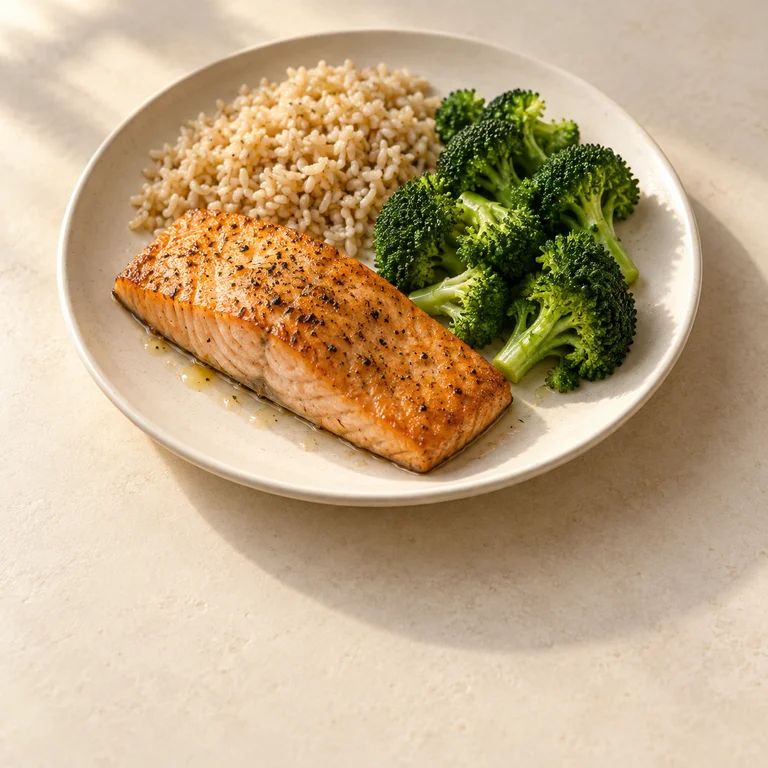
Salmon, brown rice & broccoli
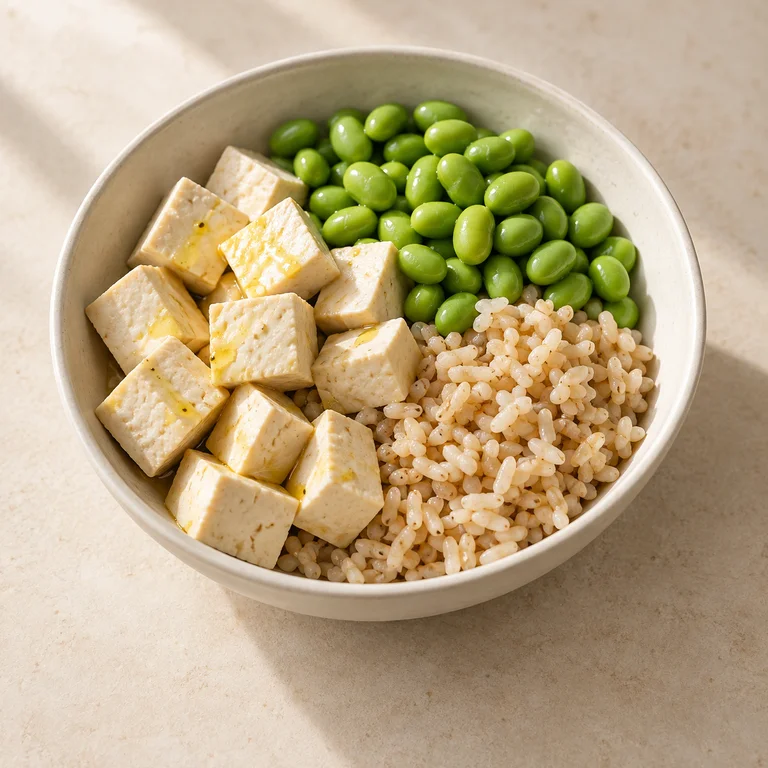
Tofu, edamame & brown rice
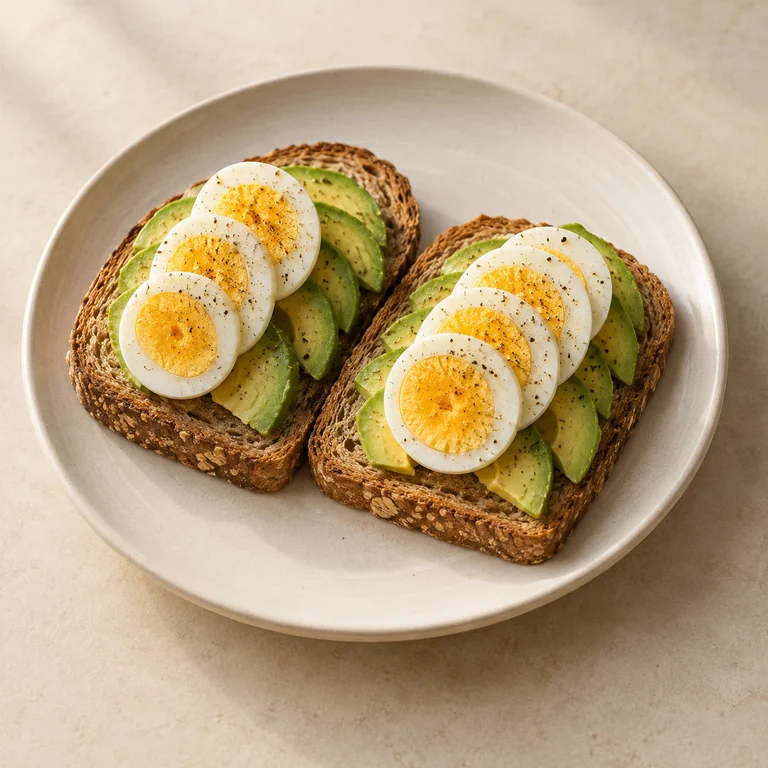
Avocado & egg toast
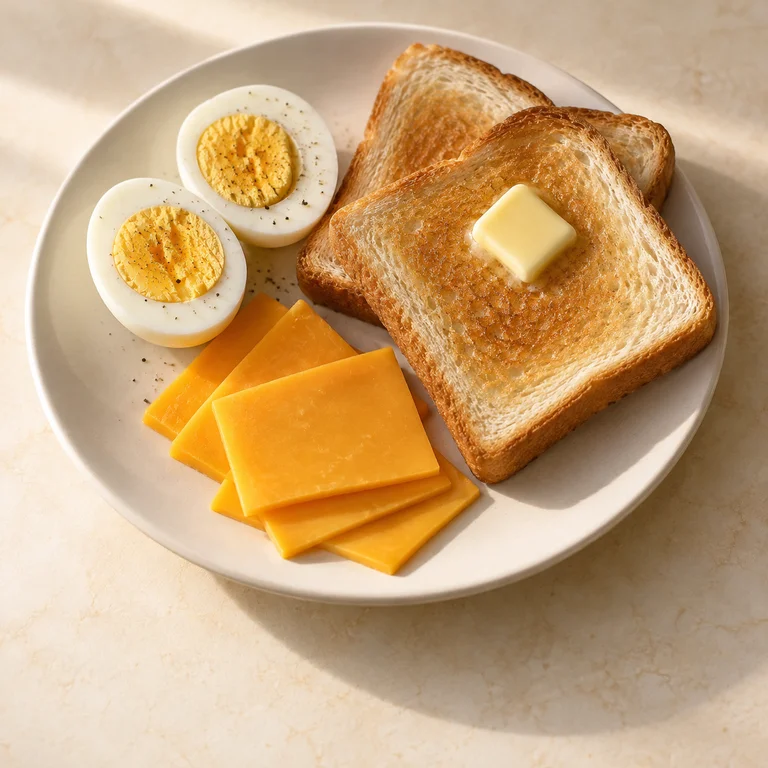
Eggs, cheddar & toast
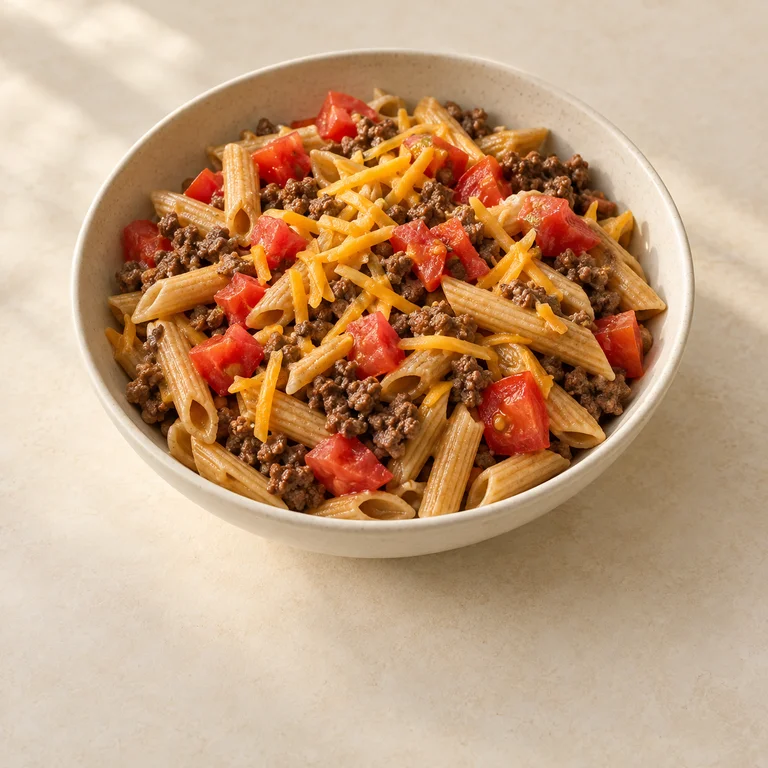
Whole-wheat pasta, beef & cheddar
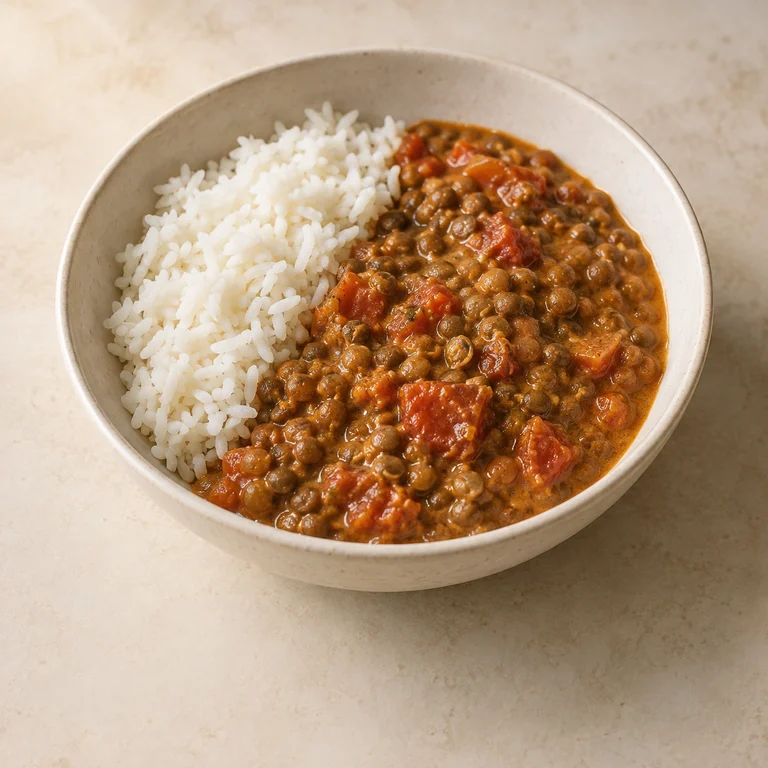
Coconut lentil curry & rice
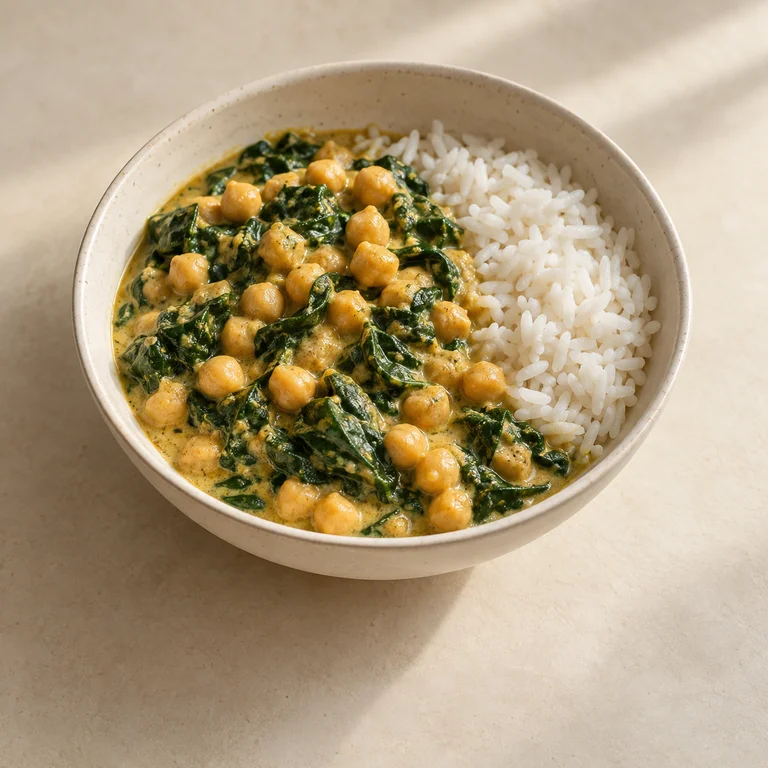
Chickpea & spinach coconut curry
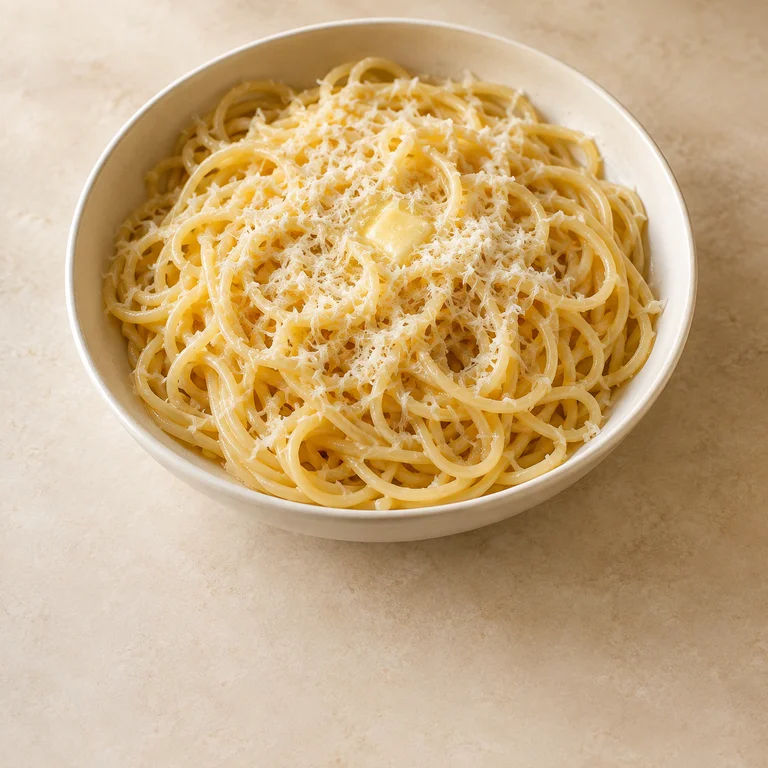
Buttered pasta & Parmesan
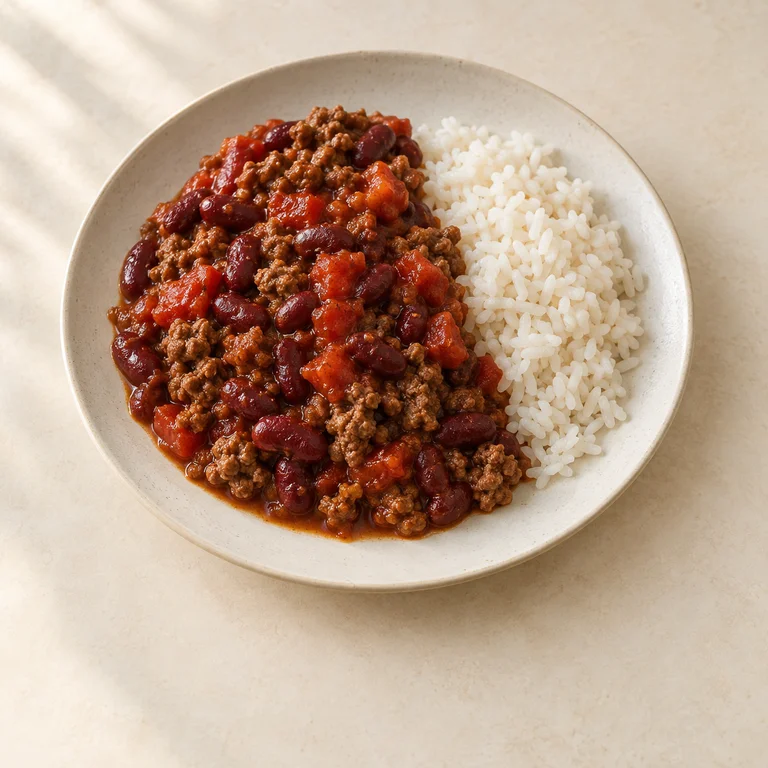
Beef & kidney bean chili
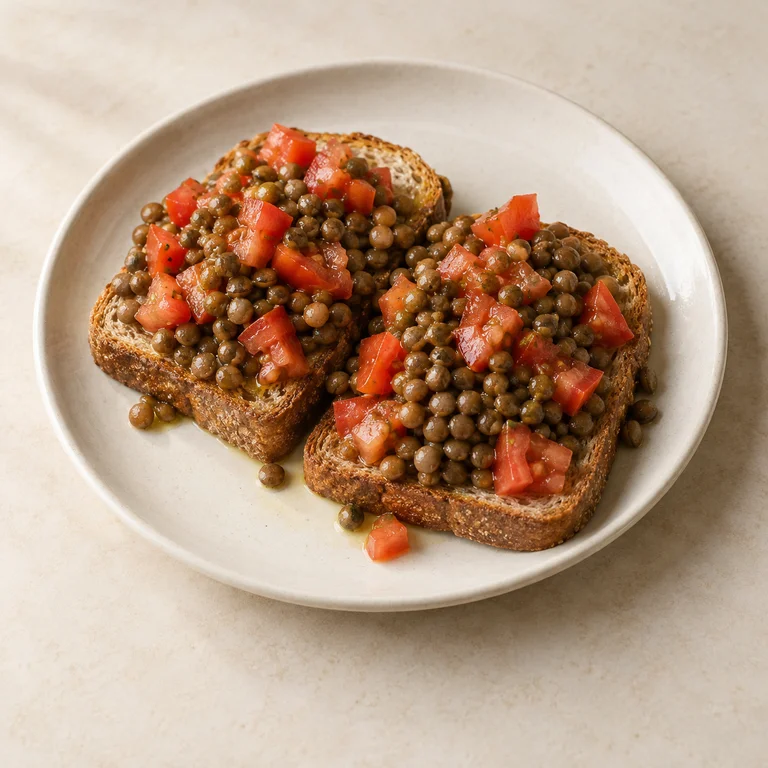
Lentils on whole-wheat toast
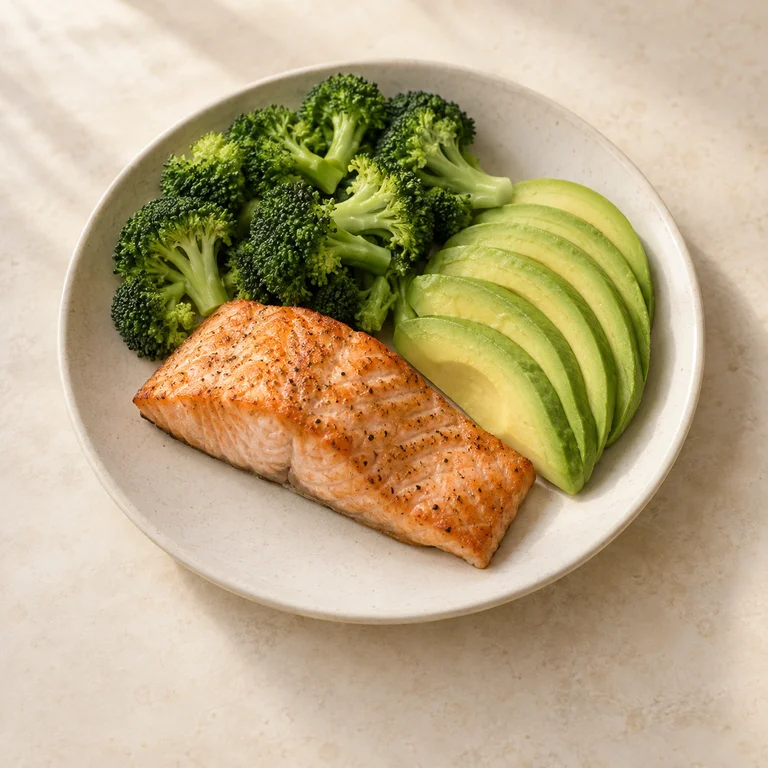
Salmon, avocado & broccoli
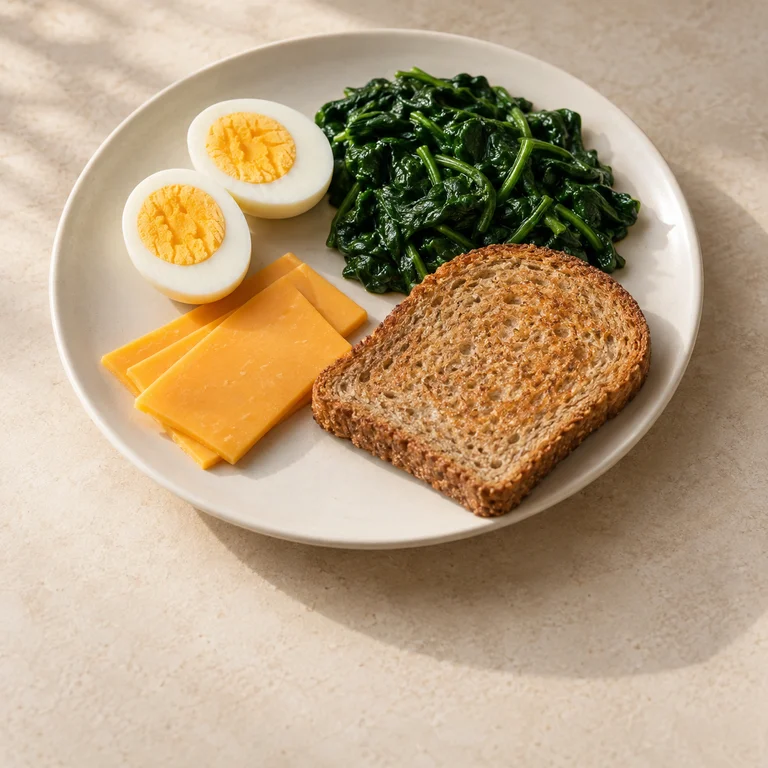
Eggs, spinach & cheddar
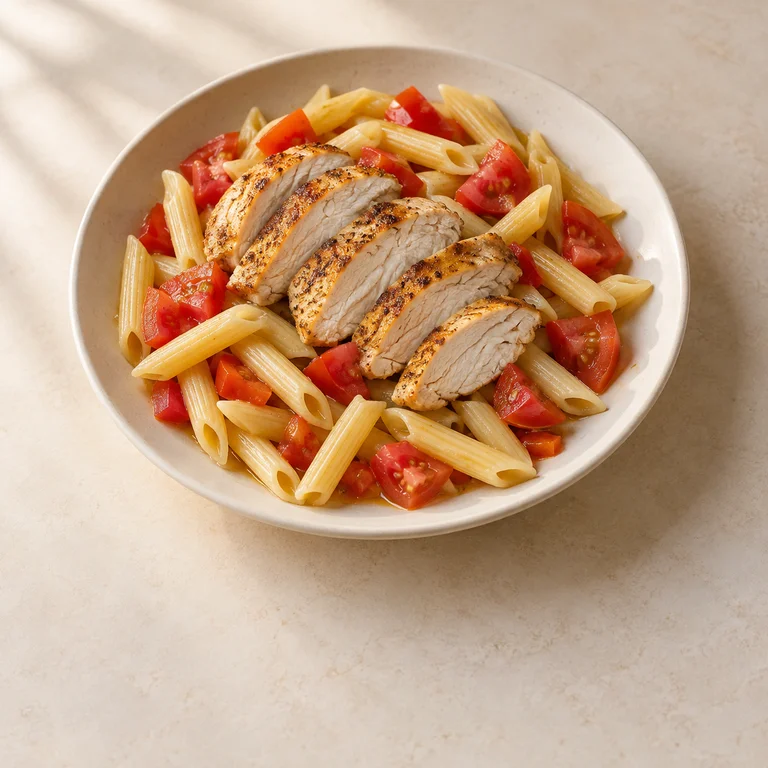
Chicken pasta with olive oil
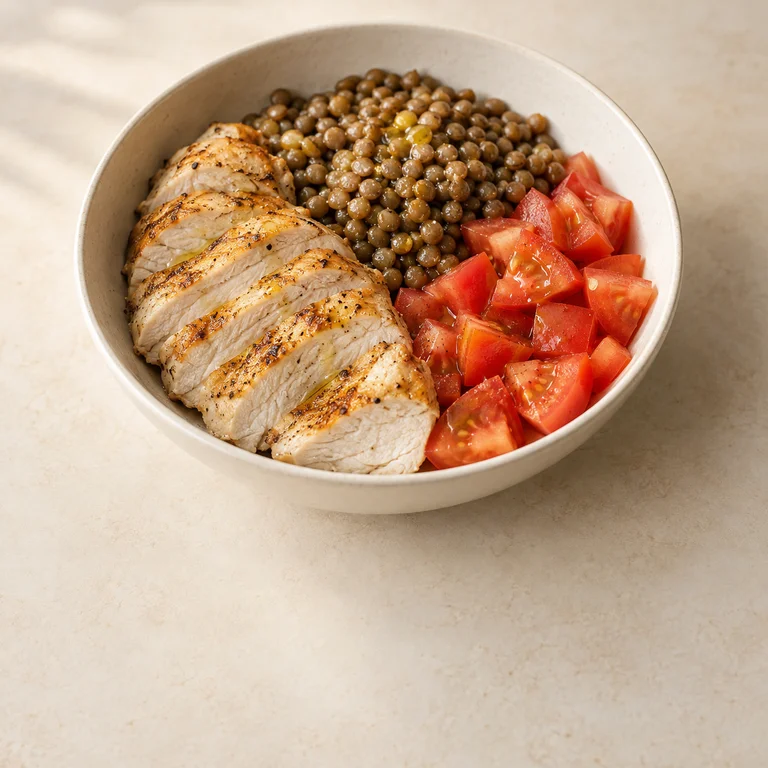
Chicken, lentils & tomato
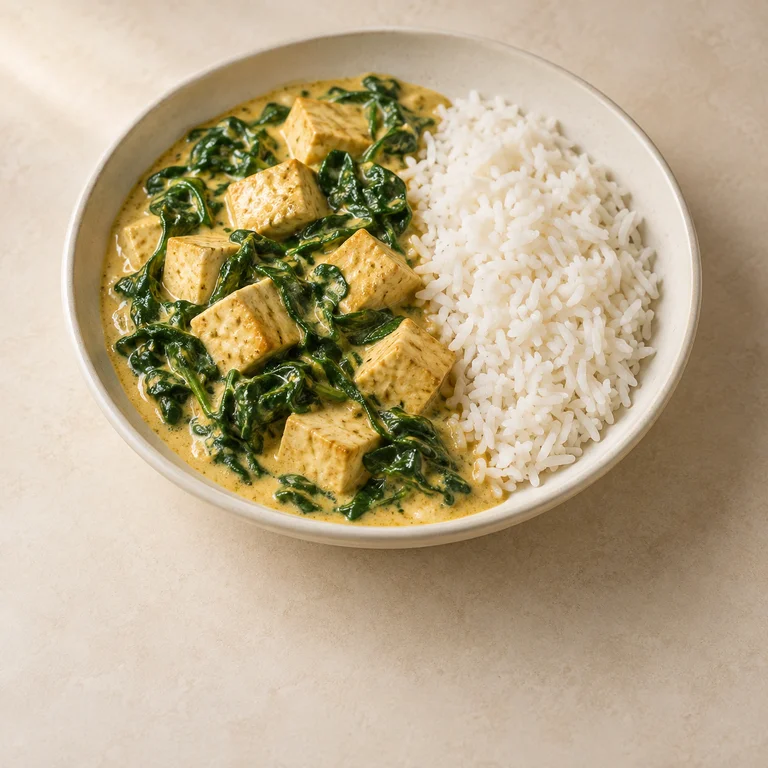
Tofu & spinach coconut curry
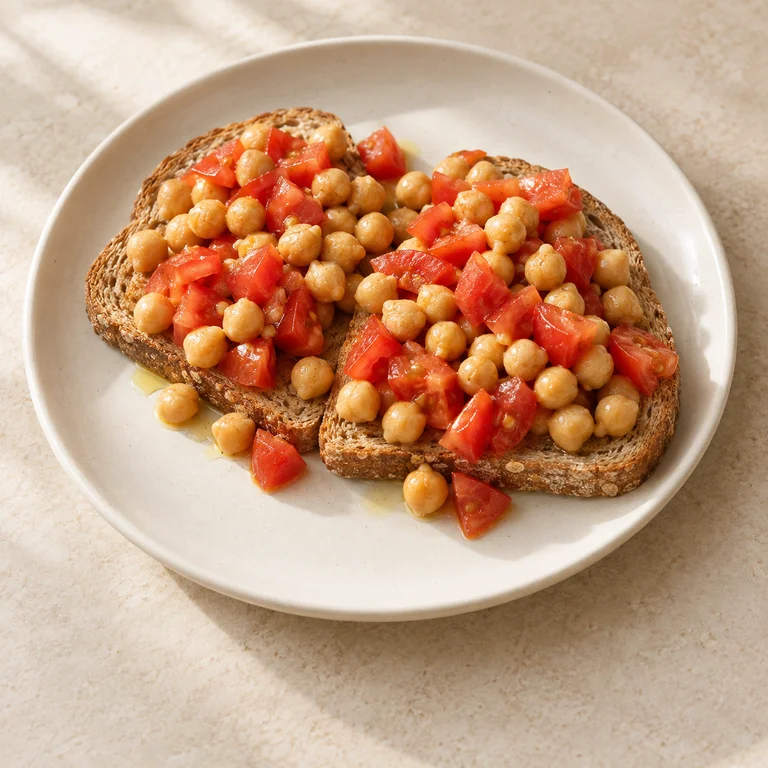
Chickpeas on whole-wheat toast
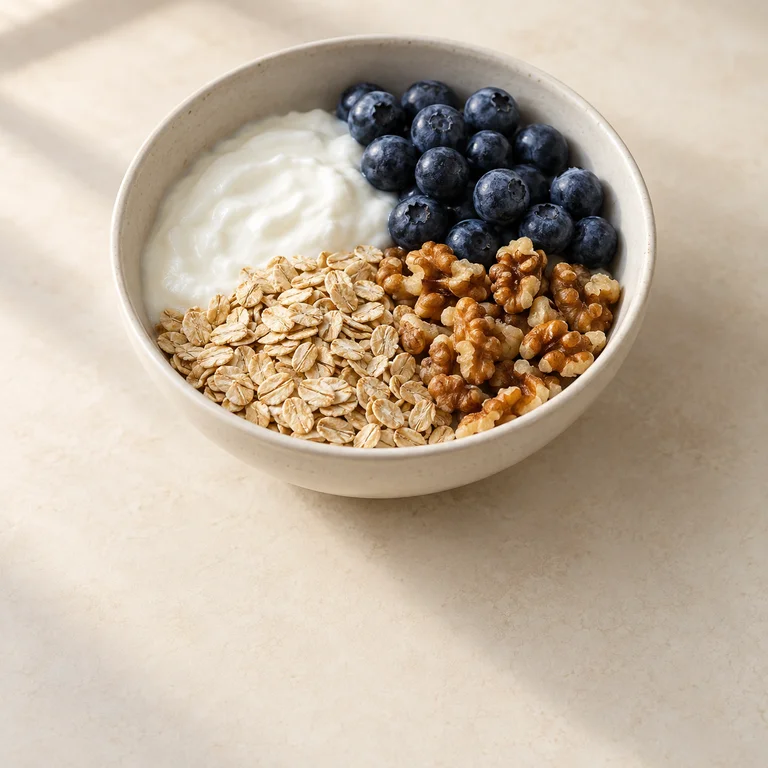
Whole-milk yogurt, oats & walnuts
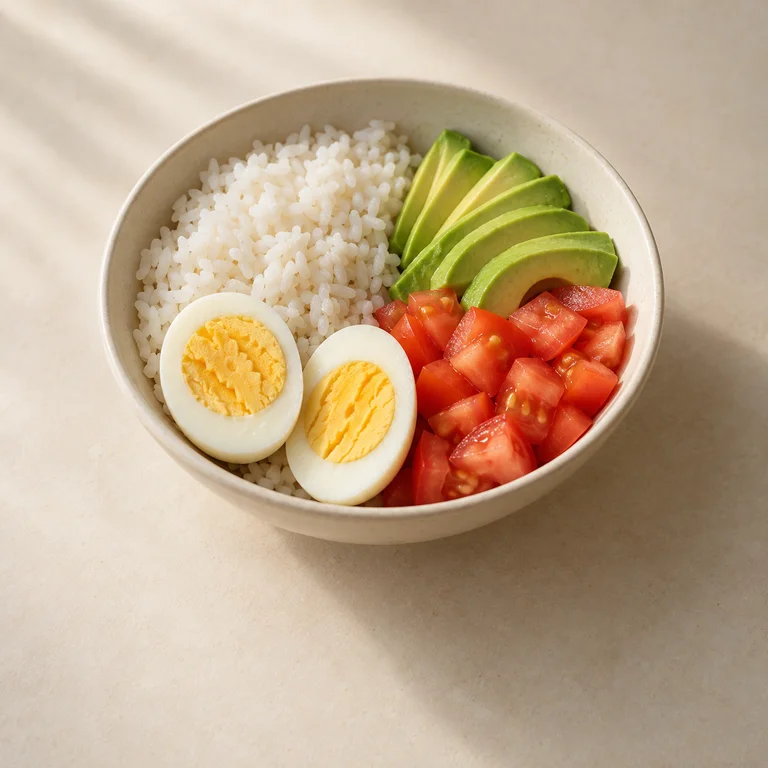
Egg, avocado & rice bowl
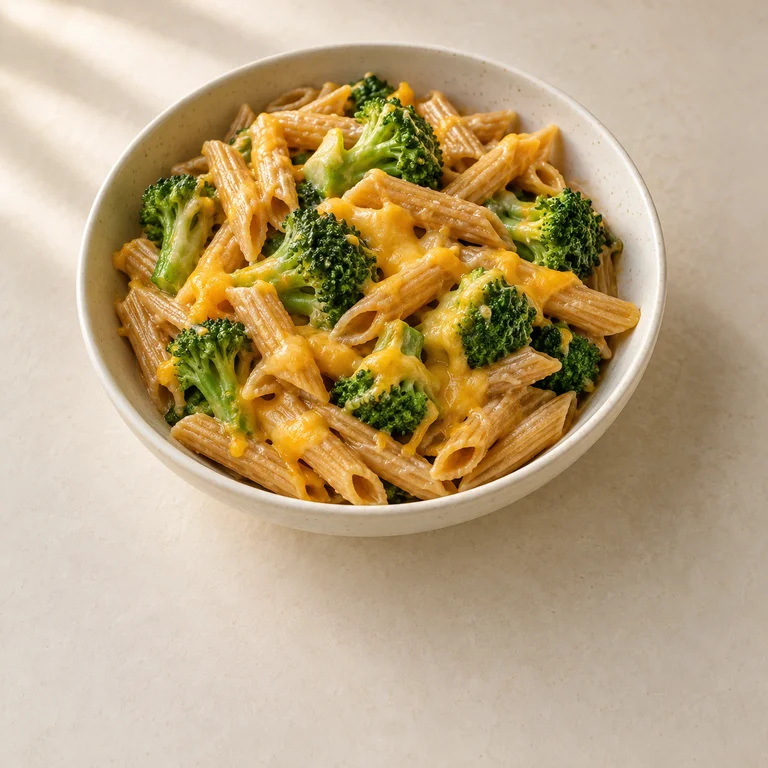
Broccoli & cheddar whole-wheat pasta
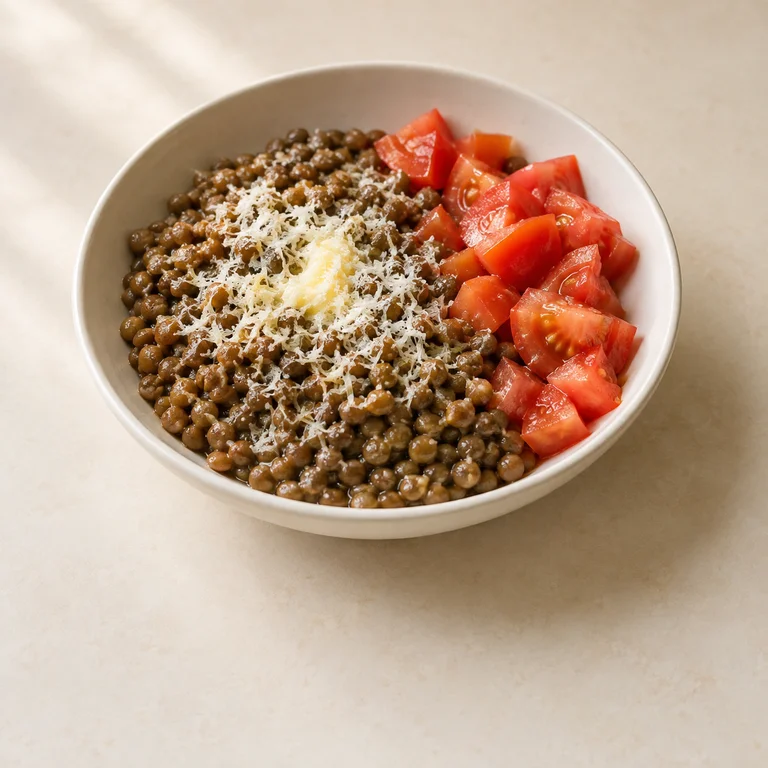
Lentils with butter & Parmesan
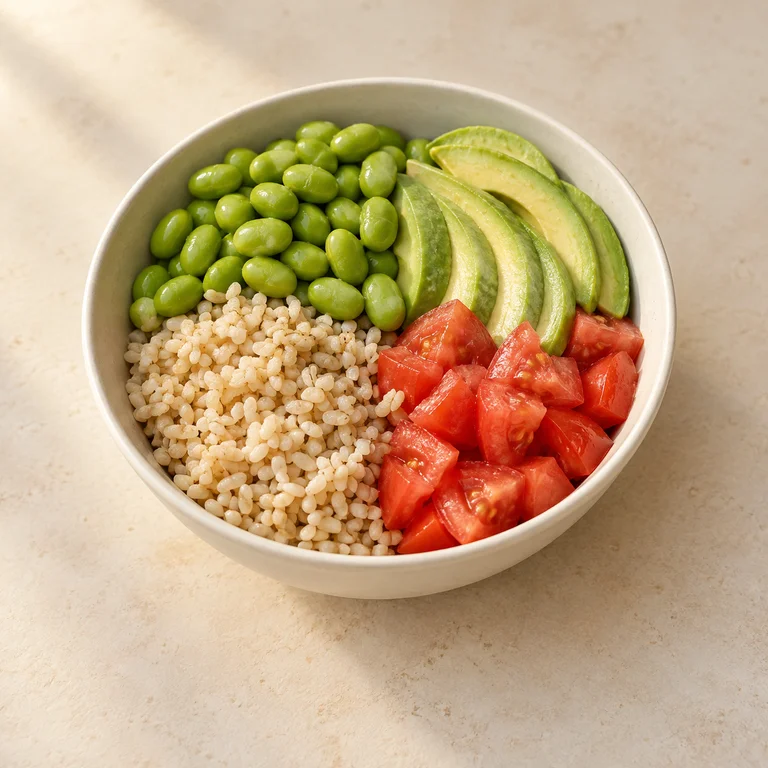
Edamame, avocado & brown rice
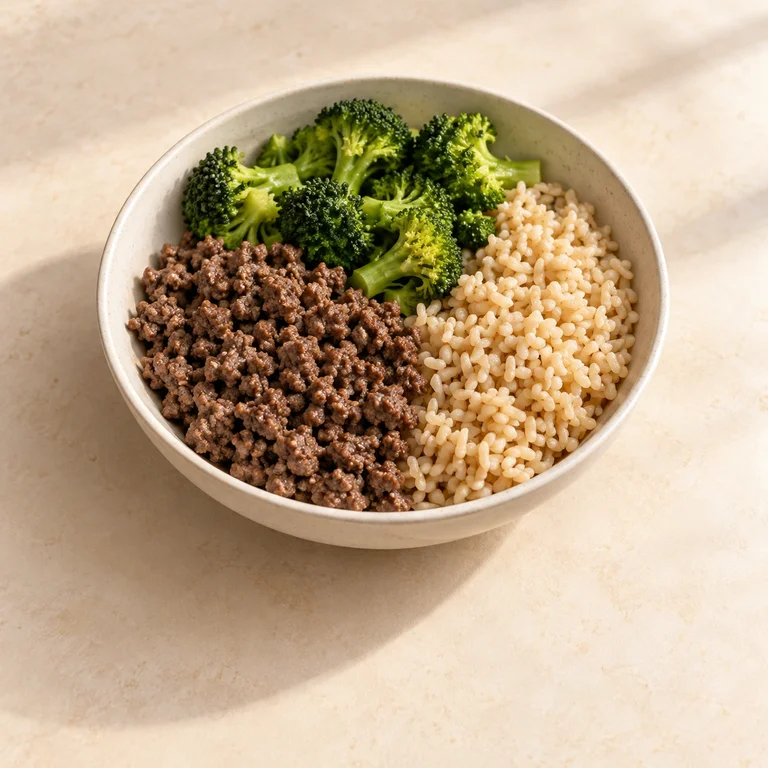
Beef, broccoli & brown rice

Egg, cheddar & avocado toast
Illustrative recipes with AI-generated photos. Values are grams per serving, rounded to whole grams; positions are adjusted slightly for readability. The central axes divide the examples, not clinical cutoffs. Scroll sideways on small screens. Ingredient weights and nutrient calculations are available below.
| Quadrant | Example meal | What could you change? |
|---|---|---|
| More fiber, less saturated fat | Lentil, rice and tomato bowl | Use it as a starting point for other bean or lentil meals |
| Less fiber, less saturated fat | Chicken and rice bowl | Replace some rice with beans |
| More fiber, more saturated fat | Whole-wheat grilled cheese with beans | Keep the beans; reduce the cheese and replace butter with oil |
| Less fiber, more saturated fat | Cheeseburger | Replace some beef with beans and use whole-grain bread |
The grid shows total fiber; the strongest LDL evidence is for soluble fiber. Even soluble fibers differ: an oat-cereal trial found that beta-glucan’s molecular weight affected LDL lowering. The grid doesn’t predict a meal’s LDL effect or overall healthfulness.
What meal swaps help you move up and left?
We calculated four recipe swaps using USDA data. The table shows nutrients per serving.
| Change | Calories, before → after | Fiber | Saturated fat | Protein | Source |
|---|---|---|---|---|---|
| Butter → olive oil on whole-wheat toast | 273 → 273 | 4.8 → 4.8 g | 5.7 → 1.7 g | 10 → 10 g | USDA SR Legacy |
| Half the beef → beans in a rice bowl | 463 → 465 | 1.8 → 9.2 g | 6.0 → 3.2 g | 31 → 27 g | USDA SR Legacy |
| White → whole-wheat bread in a chicken sandwich | 354 → 343 | 2.8 → 5.4 g | 1.4 → 1.4 g | 32 → 35 g | USDA SR Legacy |
| Whole-milk → nonfat yogurt in an oat bowl | 301 → 292 | 6.0 → 6.0 g | 4.0 → 0.7 g | 12 → 16 g | USDA SR Legacy |
In the rice bowl, we replaced 100 grams of cooked beef with 50 grams of beef and 100 grams of cooked kidney beans, keeping the rice and tomato unchanged.
Choose the swap that improves your meal: whole-grain bread adds fiber; replacing butter with oil lowers saturated fat.
Brand and portion size affect the numbers. Our ingredient weights, USDA nutrient records, and recipe totals are available to check or adapt.
How do you know whether the changes are working?
Log your meals in Empirical Health and agree on a follow-up blood test with your clinician. Record medication changes too, so you can interpret whether your diet and treatment are bringing LDL toward your goal.
How we calculated the meals and swaps
The 30 example meals and four recipe pairs use the USDA SR Legacy dataset. They are illustrative recipes, not user meal logs or meals tested in a clinical trial.
We summed each ingredient’s nutrients per 100 grams multiplied by its edible weight. Rice, pasta, meat, beans, lentils, and vegetables use the preparation states listed in the downloadable ingredient records. Oats use dry weight; tofu uses a firm raw-tofu record. Coconut milk uses the USDA raw, full-fat coconut-milk record (expressed from grated coconut and water), which differs from canned products and coconut beverages. Ground beef uses the cooked, broiled 85% lean record. The cheeseburger uses a generic commercial white-bread record for its bread portion. We added no unlisted cooking fat. Actual brands and preparation will differ.
The meal cards and tables show nutrients per actual serving. Rounding occurs after calculation. The photos are AI-generated illustrations of the recipes, not photographs of weighed portions or user meals. Nutrient calculations do not establish a clinical LDL response.
The table lists portions for 15 examples; downloads below cover all 30. Rice, meat, lentils, and beans are weighed cooked; oats are weighed dry.
| Meal | Ingredients and portions | Calories | Fiber | Saturated fat | Source |
|---|---|---|---|---|---|
| Lentil, rice & tomato bowl | 180 g lentils, 75 g white rice, 100 g tomato, 5 g olive oil | 369 | 15.7 g | 0.9 g | USDA SR Legacy |
| Kidney bean & rice bowl | 150 g kidney beans, 100 g white rice, 100 g tomato, 5 g olive oil | 383 | 12.7 g | 0.9 g | USDA SR Legacy |
| Oats, yogurt, berries & walnuts | 40 g oats, 170 g nonfat yogurt, 80 g blueberries, 15 g walnuts | 391 | 7.0 g | 1.6 g | USDA SR Legacy |
| Chicken & rice bowl | 100 g chicken breast, 150 g white rice, 100 g tomato, 5 g olive oil | 422 | 1.8 g | 1.8 g | USDA SR Legacy |
| Beef & rice bowl | 100 g ground beef, 150 g white rice, 100 g tomato | 463 | 1.8 g | 6.0 g | USDA SR Legacy |
| Cheeseburger | 100 g ground beef, 80 g white bread, 30 g cheddar, 50 g tomato | 593 | 2.8 g | 12.1 g | USDA SR Legacy |
| Whole-wheat grilled cheese & beans | 80 g whole-wheat bread, 50 g cheddar, 8 g butter, 120 g kidney beans | 613 | 13.7 g | 14.2 g | USDA SR Legacy |
| Salmon, brown rice & broccoli | 100 g salmon, 120 g brown rice, 120 g broccoli, 5 g olive oil | 440 | 5.9 g | 3.5 g | USDA SR Legacy |
| Tofu, edamame & brown rice | 120 g firm tofu, 100 g edamame, 100 g brown rice, 5 g olive oil | 461 | 9.6 g | 3.1 g | USDA SR Legacy |
| Avocado & egg toast | 80 g whole-wheat bread, 100 g avocado, 50 g hard-boiled egg | 439 | 11.5 g | 4.3 g | USDA SR Legacy |
| Eggs, cheddar & toast | 100 g hard-boiled eggs, 40 g cheddar, 80 g white bread, 5 g butter | 565 | 2.2 g | 14.0 g | USDA SR Legacy |
| Whole-wheat pasta, beef & cheddar | 180 g whole-wheat pasta, 80 g ground beef, 30 g cheddar, 100 g tomato | 607 | 8.2 g | 10.9 g | USDA SR Legacy |
| Coconut lentil curry & rice | 180 g lentils, 60 g coconut milk, 75 g white rice, 100 g tomato | 462 | 17.0 g | 12.8 g | USDA SR Legacy |
| Chickpea & spinach coconut curry | 150 g chickpeas, 100 g spinach, 40 g coconut milk, 75 g white rice | 458 | 15.0 g | 8.9 g | USDA SR Legacy |
| Buttered pasta & Parmesan | 180 g pasta, 25 g butter, 30 g Parmesan | 581 | 3.2 g | 17.6 g | USDA SR Legacy |
These are specific recipes, not averages for every meal with the same name. Portions, brands, and preparation change the numbers. You can download the ingredient weights, nutrient records, and calculated totals.
Get your free 30-day heart health guide
Evidence-based steps to optimize your heart health.