Normal range: 0 – 130 mg/dL (lower is better)
Non-HDL cholesterol equals total cholesterol minus HDL. It captures all atherogenic particles (LDL, VLDL, IDL, and Lp(a)) in a single value. Many cardiologists consider it a stronger predictor of cardiovascular risk than LDL alone because it includes triglyceride-rich particles that LDL misses. It is especially useful when triglycerides are elevated, since high triglycerides make LDL calculations less accurate.
Non-HDL is calculated rather than ordered on its own, so it comes with a standard lipid panel (about $45). A fuller workup adds Vitamin D ($75), hs-CRP ($69), ApoB ($50), and ApoA1 ($50). You can test Non-HDL and 100 other biomarkers for $190 as part of an Empirical membership.
Empirical is FSA/HSA eligible, so you can pay with pre-tax dollars. Fast for 8-12 hours beforehand for the most accurate lipid and metabolic results, and expect results in days rather than weeks.
Non-HDL cholesterol includes all “bad” types of cholesterol and is a strong predictor of cardiovascular risk.
Non-HDL Cholesterol stays relatively flat across adult ages (correlation with age, r = -0.00). Most of the spread in the chart below comes from differences between people rather than from age.
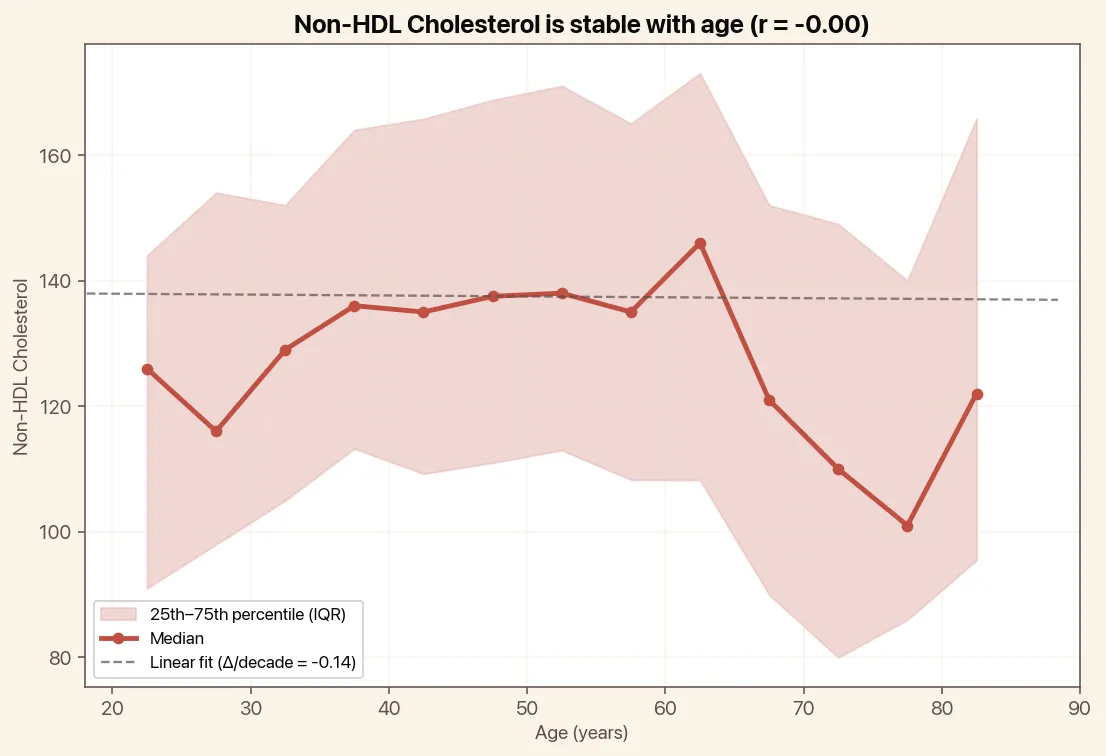
A normal Non-HDL is 0 – 130 mg/dL. Lower is better.
The same factors that elevate LDL and triglycerides raise non-HDL: poor diet, obesity, insulin resistance, and genetics. Because non-HDL includes VLDL, high triglycerides from excess carbohydrate or alcohol intake will push non-HDL above target even if LDL looks acceptable.
The lifestyle changes that lower LDL and triglycerides both help here: reducing saturated fat, cutting back on refined carbs and alcohol, exercising regularly, and losing excess weight. Statins lower non-HDL effectively, and adding ezetimibe or a fibrate can provide additional benefit when triglycerides are a major contributor.
Non-HDL is most highly correlated with LDL Cholesterol and Total Cholesterol. Here are the top biomarkers correlated with Non-HDL, based on 500,000 tests done by Empirical Health.
The percentage shows how strongly two biomarkers move together. A higher number means the relationship is stronger. Green = rises and falls together. Orange = one rises as the other falls.
Non-HDL is drawn at 2,200+ Quest and BioReference patient service centers across the US, so there's usually one within a short drive. Browse the full directory to find the one closest to you.
Test your Non-HDL Cholesterol and 100+ other biomarkers in a single blood draw.