Normal range: Below 0.21 (lower is better)
The Atherogenic Index of Plasma (AIP) is calculated as log(triglycerides/HDL) and correlates with the concentration of small, dense LDL particles, which are the most dangerous form of LDL. Values above 0.21 are associated with elevated cardiovascular risk. AIP is especially useful as an early warning sign of metabolic dysfunction because it often worsens before standard markers like LDL do.
AIP is calculated rather than ordered on its own, so it comes with a standard lipid panel (about $45). A fuller workup adds Vitamin D ($75), hs-CRP ($69), ApoB ($50), and ApoA1 ($50). You can test AIP and 100 other biomarkers for $190 as part of an Empirical membership.
Empirical is FSA/HSA eligible, so you can pay with pre-tax dollars. Fast for 8-12 hours beforehand for the most accurate lipid and metabolic results, and expect results in days rather than weeks.
The Atherogenic Index of Plasma (AIP) is calculated as log(triglycerides/HDL) and correlates with the concentration of small, dense LDL particles, which are the most dangerous form of LDL. Values above 0.21 are associated with elevated cardiovascular risk. AIP is especially useful as an early warning sign of metabolic dysfunction because it often worsens before standard markers like LDL do.
Atherogenic Index of Plasma stays relatively flat across adult ages (correlation with age, r = +0.01). Most of the spread in the chart below comes from differences between people rather than from age.
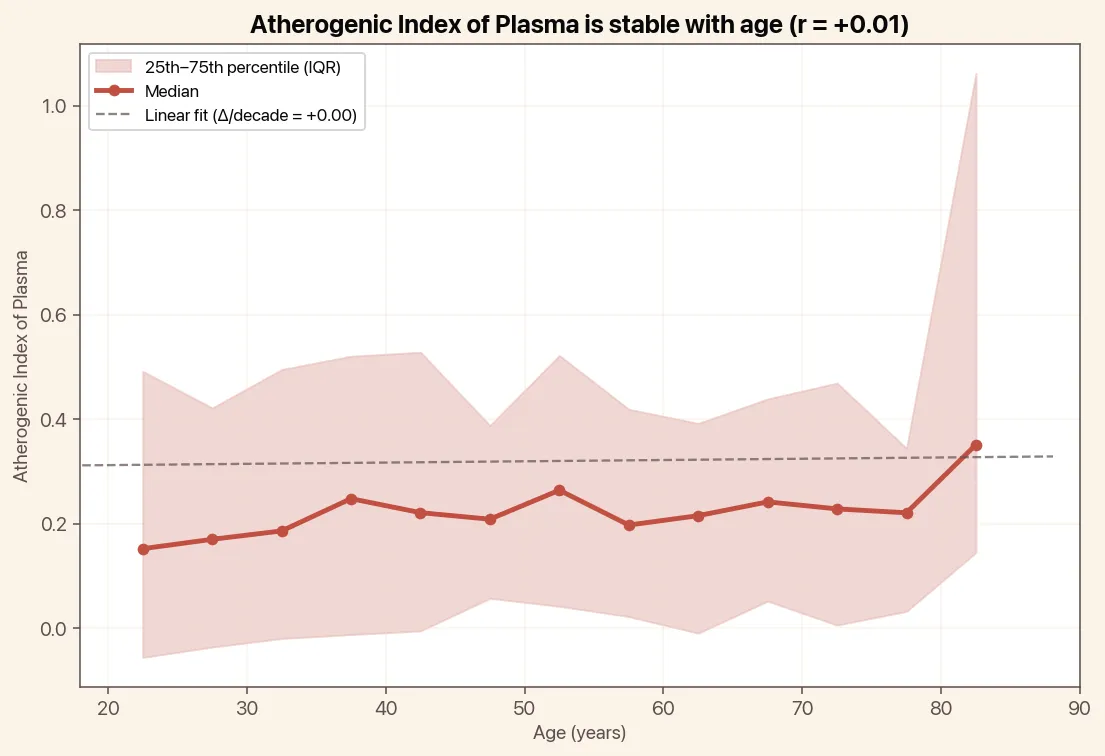

A normal AIP is Below 0.21. Lower is better.
A high AIP is driven by the same metabolic dysfunction that raises the TG/HDL ratio: insulin resistance, excess carbohydrate and alcohol intake, obesity, and physical inactivity. It is one of the earliest lipid markers to worsen in metabolic syndrome.
Because AIP is derived from triglycerides and HDL, the same powerful lifestyle changes apply: cutting sugar and refined carbs, reducing alcohol, exercising regularly, and losing excess weight. These interventions can shift AIP from high-risk to low-risk in a matter of months for many people.
AIP is most highly correlated with Triglycerides and Estimated VLDL. Here are the top biomarkers correlated with AIP, based on 500,000 tests done by Empirical Health.
The percentage shows how strongly two biomarkers move together. A higher number means the relationship is stronger. Green = rises and falls together. Orange = one rises as the other falls.
AIP is drawn at 2,200+ Quest and BioReference patient service centers across the US, so there's usually one within a short drive. Browse the full directory to find the one closest to you.
Test your Atherogenic Index of Plasma and 100+ other biomarkers in a single blood draw.