A1C measures your average blood sugar over the past 2-3 months. Below 5.7% is normal. Between 5.7-6.4% signals prediabetes. 6.5% or higher indicates diabetes. The 2026 AHA/ACC guidelines include A1C in the new PREVENT equations for predicting heart disease, because blood sugar control directly impacts cardiovascular risk.
What is a normal A1c by age?
A1c rises gradually with age. In NHANES 2021-2023, the median A1c for adults under 30 was about 5.1%. By age 60, the median reaches 5.7%, sitting right at the prediabetes threshold. The 90th percentile widens sharply after age 40, reflecting the rising prevalence of prediabetes and type 2 diabetes in middle and older age.
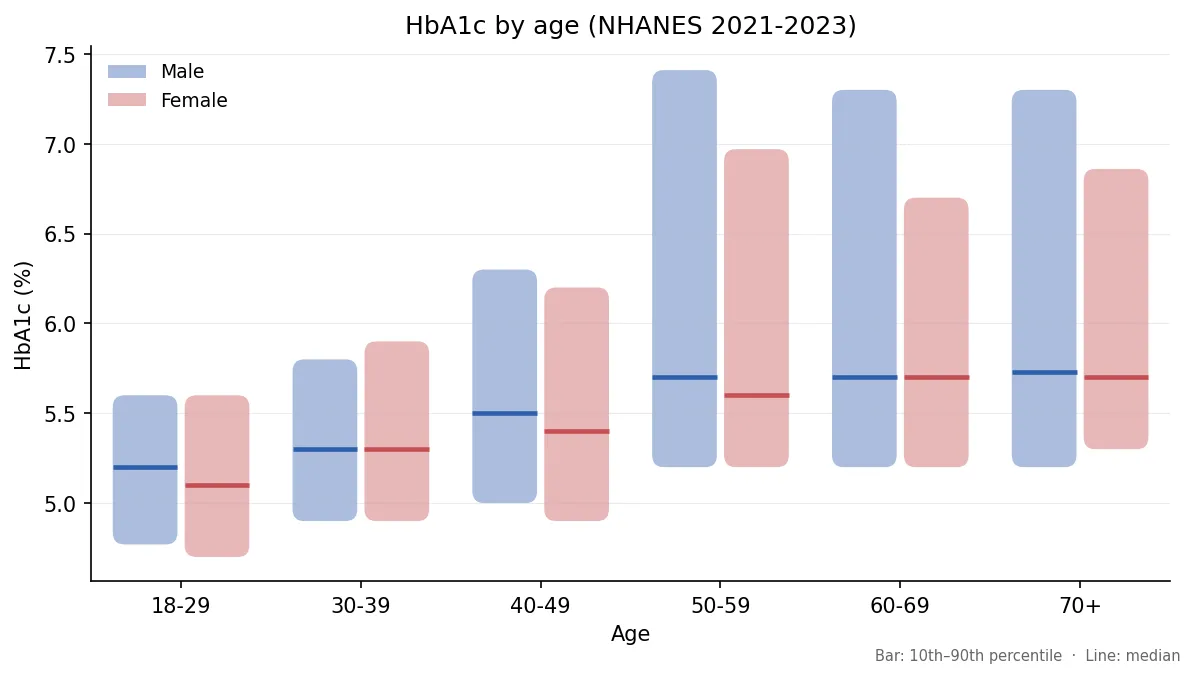 Median A1c by age and sex, with the 10th to 90th percentile band. Source: NHANES 2021-2023 (n = 6,002 adults), weighted estimates.
HbA1c vs A1c
HbA1c and A1c are the same test. The full name is hemoglobin A1c, which gets shortened to either HbA1c or A1c depending on context. Doctors and lab reports tend to write “HbA1c” or “hemoglobin A1c.” Patients, news articles, and ADA materials usually just say “A1c.”
There is no difference in what is measured, how the blood is drawn, the reference ranges, or how the result is interpreted. If your lab report shows one and your doctor mentions the other, they are talking about the same number.
You may also see “glycated hemoglobin” or “glycohemoglobin” used interchangeably. These describe the underlying biology (hemoglobin with glucose attached) rather than the specific test.
What does an A1c of 5.7 mean?
An A1c of 5.7% sits right at the threshold where prediabetes begins. Below 5.7% is normal. 5.7-6.4% is prediabetes. 6.5% or higher indicates diabetes. So 5.7% is the bottom edge of the prediabetes range.
In practical terms, an A1c of 5.7% corresponds to an estimated average glucose of about 117 mg/dL. That is mildly elevated, not dangerous on its own, but a signal that your body is starting to struggle with blood sugar regulation. Without changes, roughly 5-10% of people with prediabetes progress to type 2 diabetes each year.
The good news is that 5.7% is one of the most reversible numbers in medicine. Losing 5-7% of body weight, exercising 150 minutes a week, and reducing refined carbs and sugar brings most people back under 5.7%. The Diabetes Prevention Program trial found these changes cut the risk of progressing to diabetes by 58%, more than the leading medication.
If your A1c is 5.7%, retest in 3-6 months to see the trend. Looking at fasting glucose and fasting insulin alongside it gives a fuller picture.