The ApoB/LDL ratio is a way to estimate LDL particle size without specialized testing. Since each LDL particle carries exactly one ApoB molecule, comparing ApoB to LDL cholesterol reveals how many particles are carrying how much cholesterol. A high ApoB relative to LDL means more particles carrying less cholesterol each (small, dense LDL, which is higher risk). A low ApoB relative to LDL means fewer particles carrying more cholesterol each (large, buoyant LDL, which is lower risk).
ApoB/LDL is calculated rather than ordered on its own, so it comes with ApoB and lipid testing (about $95). A fuller workup adds Vitamin D ($75), hs-CRP ($69), ApoB ($50), and ApoA1 ($50). You can test ApoB/LDL and 100 other biomarkers for $190 as part of an Empirical membership.
Empirical is FSA/HSA eligible, so you can pay with pre-tax dollars. Fast for 8-12 hours beforehand for the most accurate lipid and metabolic results, and expect results in days rather than weeks.
The ApoB/LDL ratio is a way to estimate LDL particle size without specialized testing. Since each LDL particle carries exactly one ApoB molecule, comparing ApoB to LDL cholesterol reveals how many particles are carrying how much cholesterol. A high ApoB relative to LDL means more particles carrying less cholesterol each (small, dense LDL, which is higher risk).
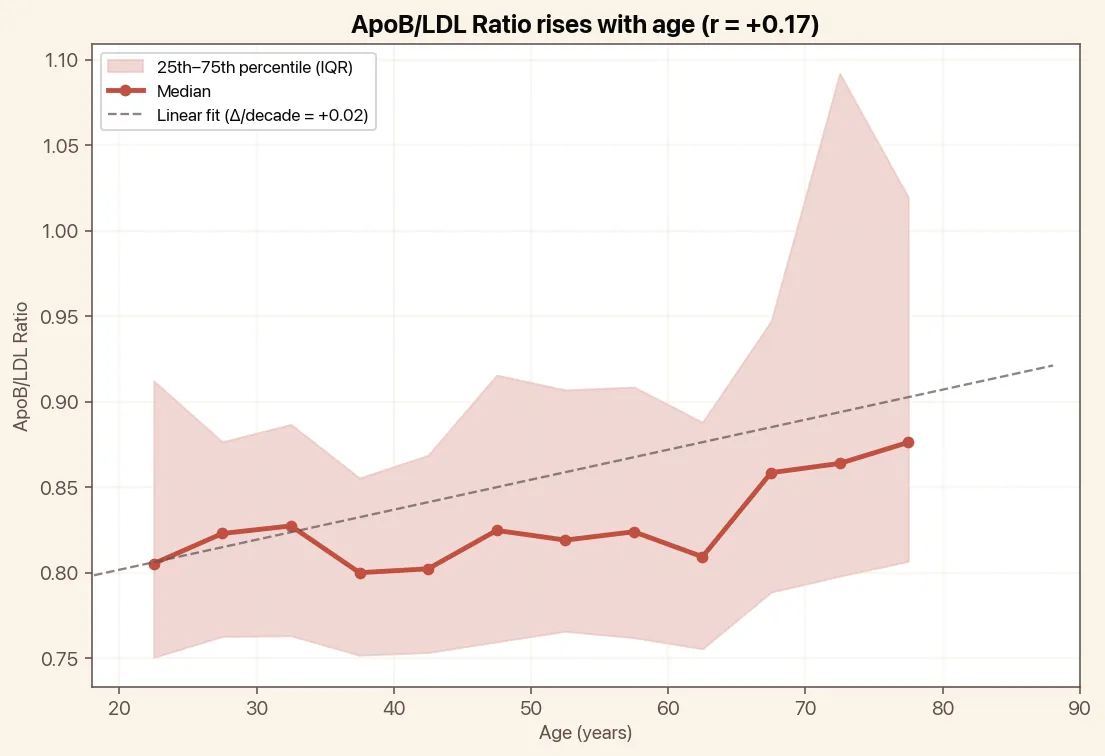
ApoB/LDL Ratio tends to rise with age (correlation with age, r = +0.17). The chart below shows the median by 5-year age bin and a linear trend line.

A discordance where ApoB is high relative to LDL suggests a predominance of small, dense LDL particles. Insulin resistance, high triglycerides, and metabolic syndrome shift LDL toward smaller particles. Weight loss and triglyceride reduction (through diet, exercise, and reducing refined carbs) typically normalize this ratio.
This ratio helps explain why two people with the same LDL cholesterol can have very different cardiovascular risk. The person with more small, dense particles (higher ApoB/LDL) carries greater risk than the person with fewer large particles.
ApoB/LDL is most highly correlated with LDL Cholesterol and Total Cholesterol. Here are the top biomarkers correlated with ApoB/LDL, based on 500,000 tests done by Empirical Health.
The percentage shows how strongly two biomarkers move together. A higher number means the relationship is stronger. Green = rises and falls together. Orange = one rises as the other falls.
ApoB/LDL is drawn at 2,200+ Quest and BioReference patient service centers across the US, so there's usually one within a short drive. Browse the full directory to find the one closest to you.
Test your ApoB/LDL Ratio and 100+ other biomarkers in a single blood draw.