Normal range: 0 – 4.5 (lower is better)
The cholesterol/HDL ratio divides your total cholesterol by your HDL and provides a quick snapshot of cardiovascular risk. Values above 4.5 are associated with elevated risk, while below 3.5 is favorable. It is more informative than total cholesterol alone because it accounts for how much of your cholesterol is protective HDL versus potentially harmful LDL and VLDL.
Chol/HDL is calculated rather than ordered on its own, so it comes with a standard lipid panel (about $45). A fuller workup adds Vitamin D ($75), hs-CRP ($69), ApoB ($50), and ApoA1 ($50). You can test Chol/HDL and 100 other biomarkers for $190 as part of an Empirical membership.
Empirical is FSA/HSA eligible, so you can pay with pre-tax dollars. Fast for 8-12 hours beforehand for the most accurate lipid and metabolic results, and expect results in days rather than weeks.
This ratio compares your total cholesterol to your “good” HDL cholesterol. A lower ratio means lower heart disease risk.
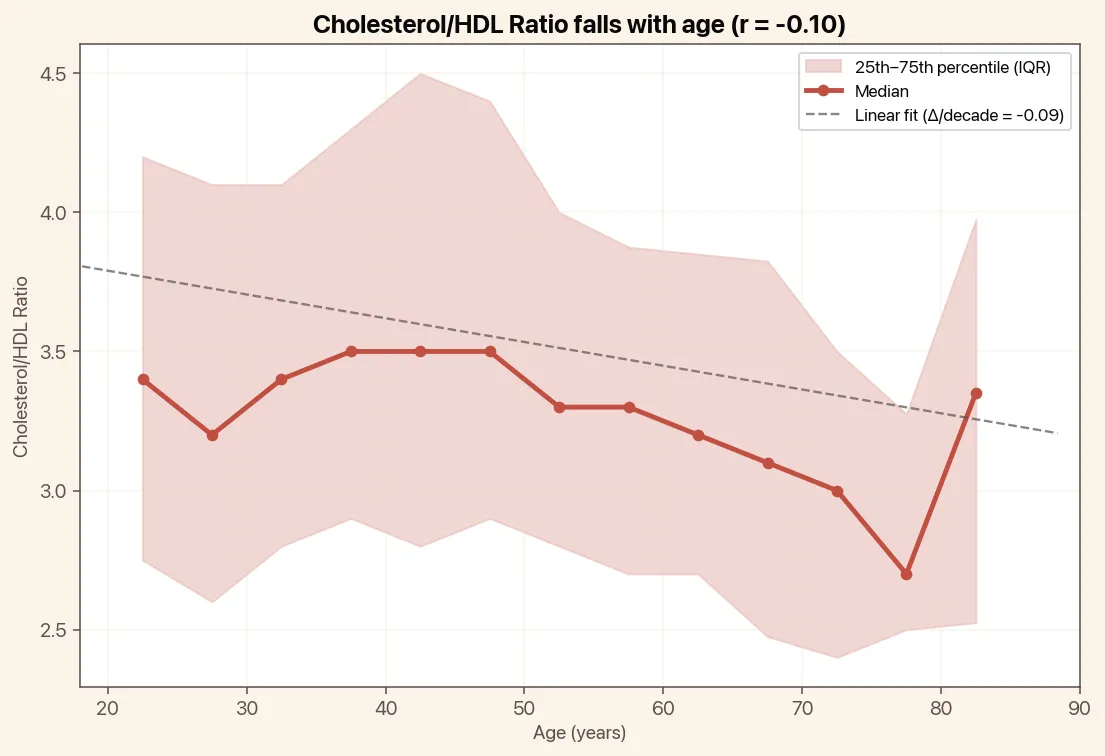
Cholesterol/HDL Ratio tends to fall with age (correlation with age, r = -0.10). The chart below shows the median by 5-year age bin and a linear trend line.

A normal Chol/HDL is 0 – 4.5. Lower is better.
A high ratio results from elevated total cholesterol, low HDL, or both. The most common pattern is low HDL from inactivity and poor diet combined with high LDL from saturated fat intake. Improving either side (raising HDL through exercise or lowering LDL through diet) will improve the ratio.
Because this is a derived ratio, all the lifestyle changes and medications that affect total cholesterol and HDL individually apply here. Regular exercise, dietary improvements, weight loss, and quitting smoking are the most effective lifestyle approaches. Statins primarily improve the ratio by lowering the numerator (total cholesterol).
Chol/HDL is most highly correlated with Non-HDL Cholesterol and Apolipoprotein B. Here are the top biomarkers correlated with Chol/HDL, based on 500,000 tests done by Empirical Health.
The percentage shows how strongly two biomarkers move together. A higher number means the relationship is stronger. Green = rises and falls together. Orange = one rises as the other falls.
Chol/HDL is drawn at 2,200+ Quest and BioReference patient service centers across the US, so there's usually one within a short drive. Browse the full directory to find the one closest to you.
Test your Cholesterol/HDL Ratio and 100+ other biomarkers in a single blood draw.